Posted on
June 1, 2022
by
Andrew Hasman
After reaching record-setting levels in 2021, home sale activity has returned to more typical seasonal levels in Metro Vancouver* this spring due, in large part, to rising interest rates.
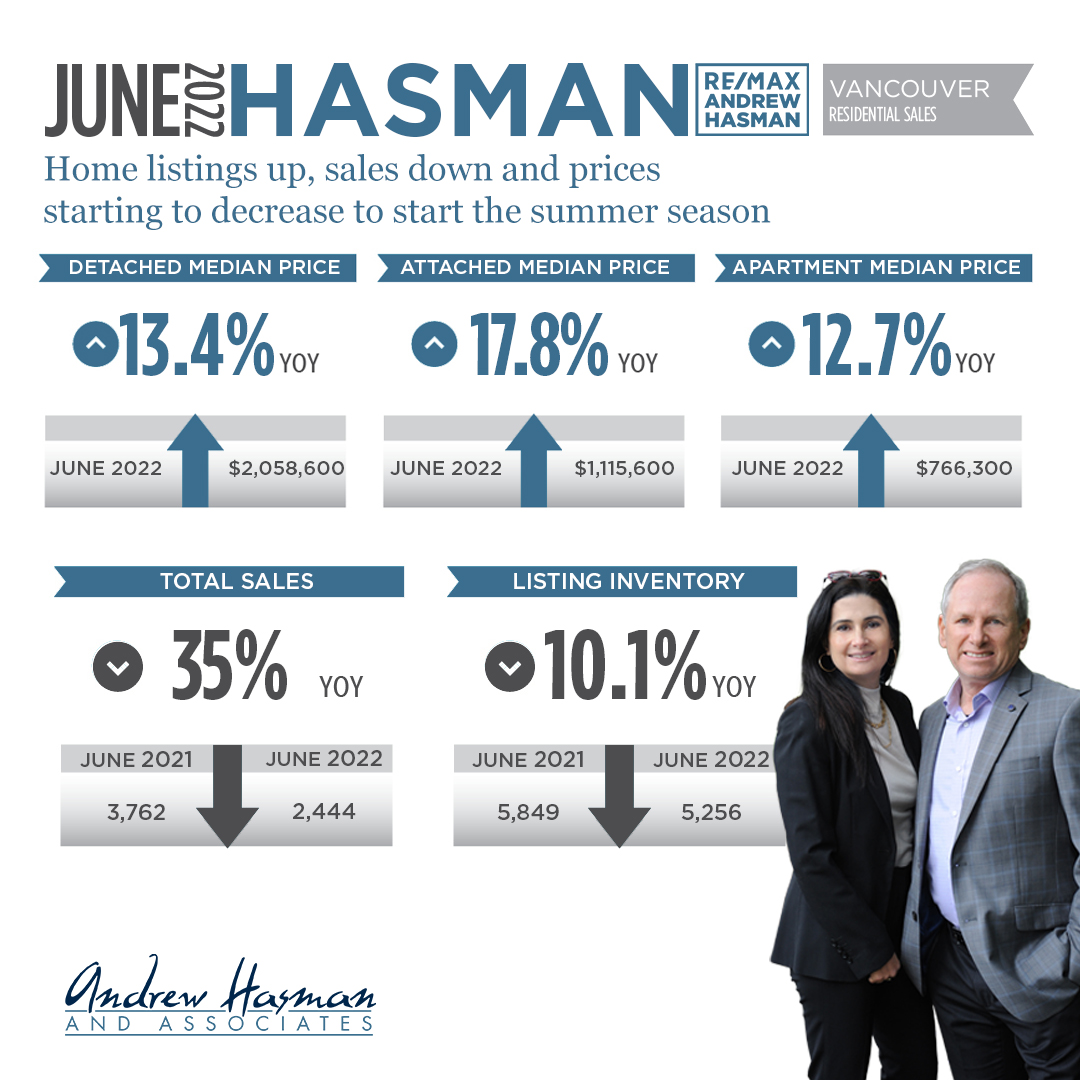
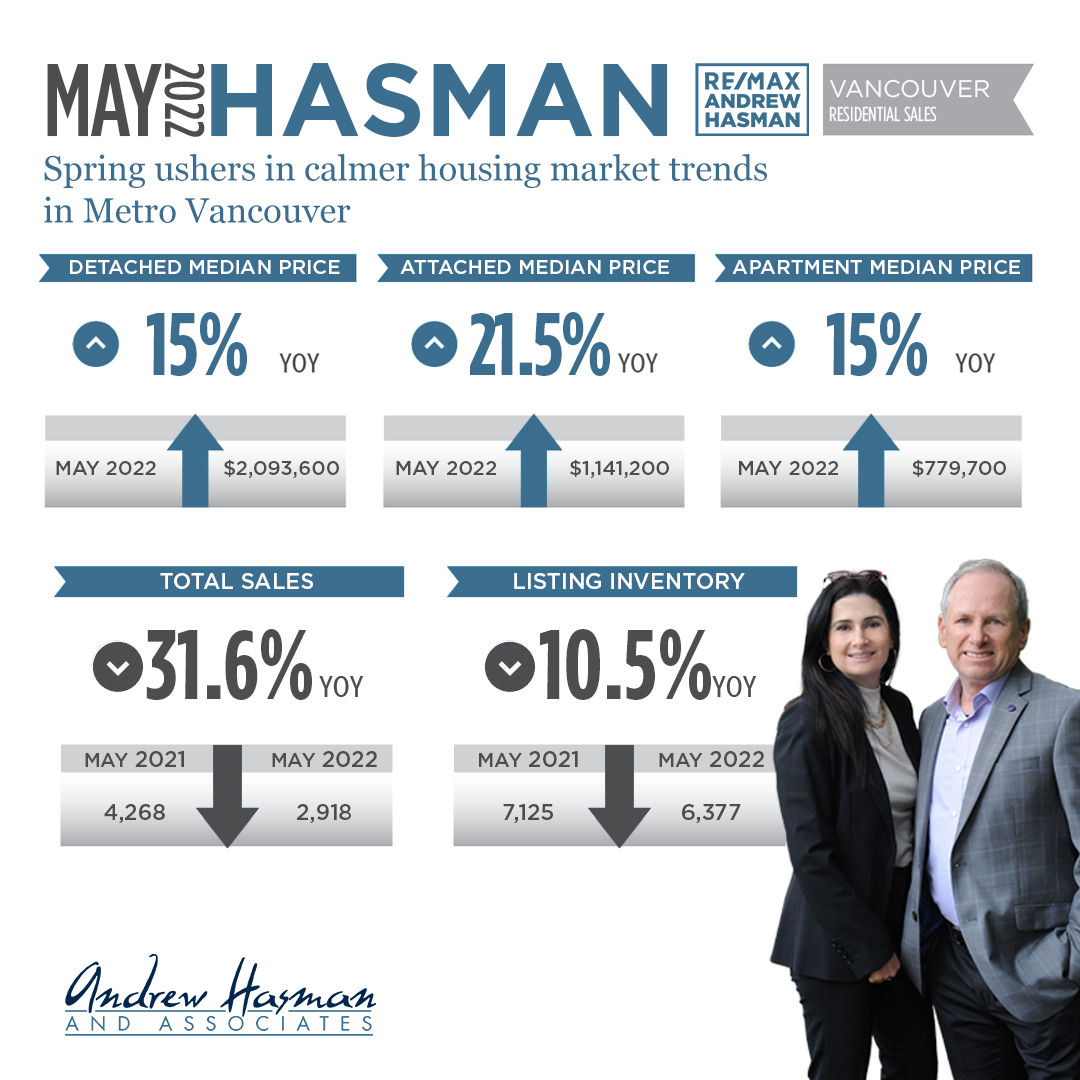
The Real Estate Board of Greater Vancouver (REBGV) reports that residential home sales in the region totalled 2,918 in May 2022, a 31.6 per cent decrease from the 4,268 sales recorded in May 2021, and a 9.7 per cent decrease from the 3,232 homes sold in April 2022.
Last month’s sales were 12.9 per cent below the 10-year May sales average.
“With interest rates rising, home buyers are taking more time to make their decisions in today’s housing market,” said Daniel John, REBGV Chair. “Home buyers have been operating in a frenzied environment for much of the past two years. This spring is providing a calmer environment, with fewer multiple offer situations, which is allowing buyers to explore their housing options, understand the changing mortgage market, and do their due diligence.”
Listings
There were 6,377 detached, attached and apartment properties newly listed for sale on the Multiple Listing Service® (MLS®) in Metro Vancouver in May 2022. This represents a 10.5 per cent decrease compared to the 7,125 homes listed in May 2021 and a 4.4 per cent increase compared to April 2022 when 6,107 homes were listed.
The total number of homes currently listed for sale on the MLS® system in Metro Vancouver is 10,010, an 8.8 per cent decrease compared to May 2021 (10,970) and a 13.8 per cent increase compared to April 2022 (8,796).
Sales-to-active listings ratio
For all property types, the sales-to-active listings ratio for May 2022 is 29.2 per cent. By property type, the ratio is 18.3 per cent for detached homes, 35.5 per cent for townhomes, and 38.1 per cent for apartments.
Generally, analysts say downward pressure on home prices occurs when the ratio dips below 12 per cent for a sustained period, while home prices often experience upward pressure when it surpasses 20 per cent over several months.
Home prices
The MLS® Home Price Index composite benchmark price for all residential properties in Metro Vancouver is currently $1,261,1001. This represents a 14.7 per cent increase over May 2021 and a 0.3 per cent decrease compared to April 2022.
“Upward pressure on home prices has begun to ease in the housing market over the last two months,” John said. “Where home prices go next will depend on housing supply. While we’re beginning to see modest increases in home listings, we still need housing supply totals to more than double to bring the market close to balanced territory.”
Broken down by property type
Sales of detached homes in May 2022 reached 793, a 44.1 per cent decrease from the 1,419 detached sales recorded in May 2021. The benchmark price for a detached home is $2,093,600. This represents a 15 per cent increase from May 2021 and a 0.4 per cent decrease compared to April 2022.
Sales of apartment homes reached 1,605 in May 2022, a 21.7 per cent decrease compared to the 2,049 sales in May 2021. The benchmark price of an apartment home is $779,700. This represents a 15 per cent increase from May 2021 and a 0.4 per cent increase compared to April 2022.
Attached home sales in May 2022 totalled 520, a 35 per cent decrease compared to the 800 sales in May 2021. The benchmark price of an attached home is $1,141,200. This represents a 21.5 per cent increase from May 2021 and a 0.6 per cent decrease compared to April 2022.
MLS® Home Price Index 2022 update
MLS® Home Price Index 2022 update: The national MLS® Home Price Index (MLS® HPI) methodology was updated during an annual review of the model in May. In line with best statistical practices, the MLS® HPI is reviewed each year.
Under the new methodology, benchmark attribute data is derived from data collected from the previous five-year rolling period. Benchmark prices are also now based on current benchmark attributes instead of linking benchmark prices to historical benchmark attributes.
In the annual review, coverage was extended to neighbourhoods where sales volumes picked up enough to support benchmark price tracking and discontinued for neighbourhoods where sales became too sparse to support benchmark price calculations. Read more about these changes.
Due to new housing development, REBGV also expanded the boundaries of the Brentwood neighbourhood in Burnaby, which affected the typical home associated with that area, Central Burnaby, and Parkcrest.
To ensure the MLS® HPI coverage is consistent and comparable, the MLS® HPI historical aggregate and composite data was recalculated based on revised and consistent coverage.

GET THE FULL REPORT


