
VANCOUVER, BC – May 2, 2023 – With listing activity remaining below historical norms, home sales in Metro Vancouver1 have mounted a surprising comeback, rising near levels seen last spring, before eight consecutive interest rate hikes eroded borrowing power and brought home sales activity down along with it.
The Real Estate Board of Greater Vancouver (REBGV) reports that residential home sales in the region totalled 2,7412 in April 2023, a 16.5 per cent decrease from the 3,281 sales recorded in April 2022, and 15.6 per cent below the 10-year seasonal average (3,249).
“The fact we are seeing prices rising and sales rebounding this spring tells us home buyers are returning with confidence after a challenging year for our market, with mortgage rates roughly doubling,” Lis said. “The latest MLS HPI® data show home prices have increased about five per cent year-to-date, which already outpaces our forecast of one to two per cent by year-end. The year is far from over, however, and it remains to be seen if these price increases will be sustained into 2024.”
There were 4,307 detached, attached and apartment properties newly listed for sale on the Multiple Listing Service® (MLS®) in Metro Vancouver in April 2023. This represents a 29.7 per cent decrease compared to the 6,128 homes listed in April 2022, and was 22 per cent below the 10-year seasonal average (5,525).
The total number of homes currently listed for sale on the MLS® system in Metro Vancouver is 8,790, a 4.2 per cent decrease compared to April 2022 (9,176), and 20.9 per cent below the 10-year seasonal average (11,117).
Across all detached, attached and apartment property types, the sales-to-active listings ratio for April 2023 is 32.7 per cent. By property type, the ratio is 24.4 per cent for detached homes, 40.1 per cent for townhomes, and 37.4 per cent for apartments.
Analysis of the historical data suggests downward pressure on home prices occurs when the ratio dips below 12 per cent for a sustained period, while home prices often experience upward pressure when it surpasses 20 per cent over several months.
“When we released our market forecast in January, we were one of the only organizations taking the contrarian view that prices were likely to appreciate in 2023,” Lis said. “And what we’re seeing unfold so far this year is consistent with our prediction that near record-low inventory levels would create competitive conditions where almost any resurgence in demand would translate to price escalation, despite the elevated borrowing cost environment. At the crux of it, the issue remains a matter of far too little resale supply available relative to the pool of active buyers in our market.”
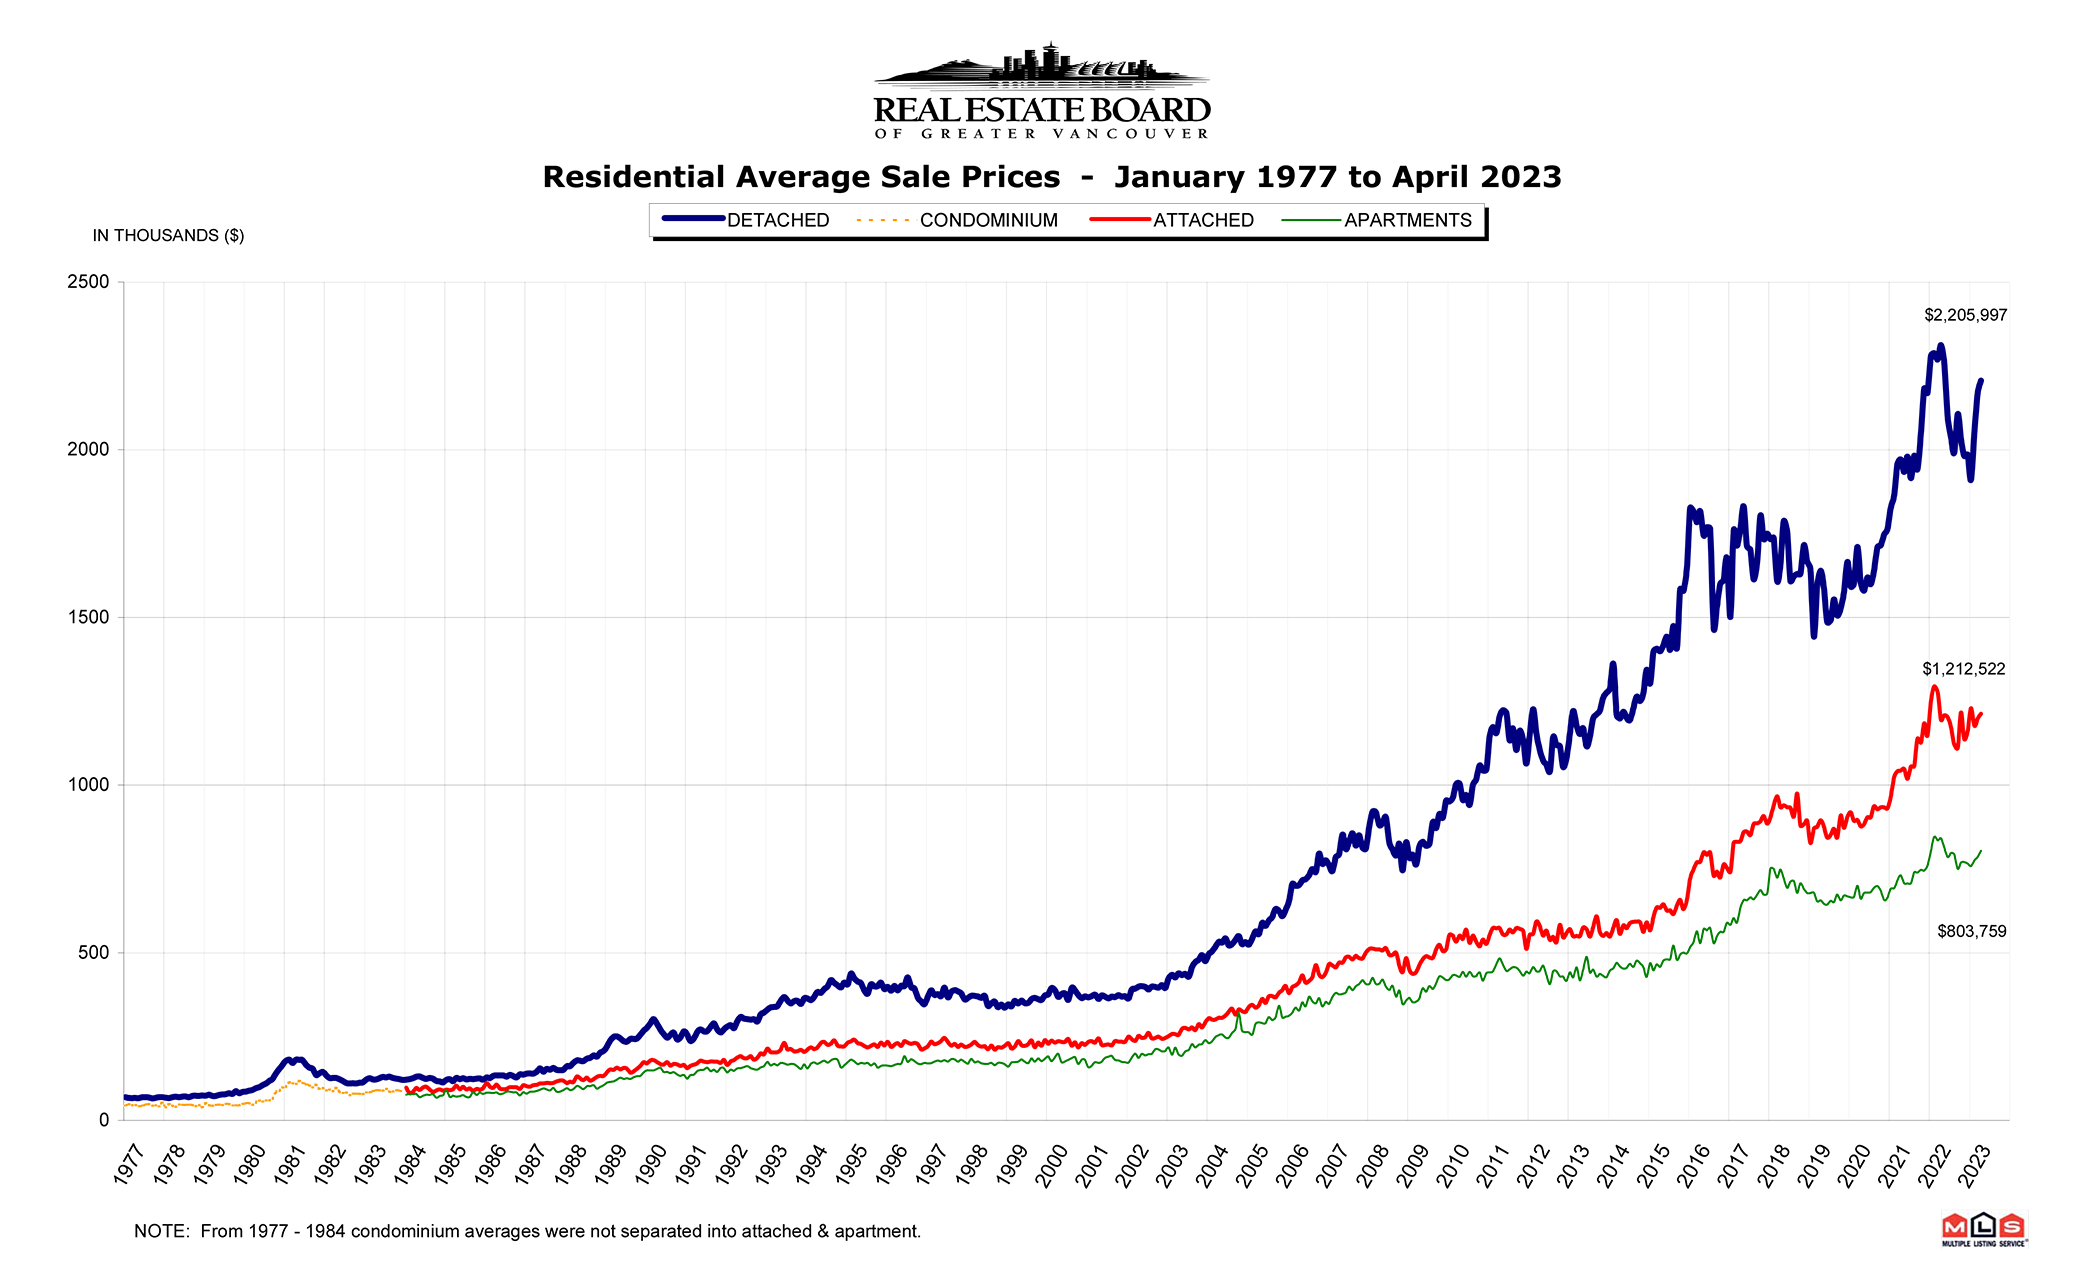
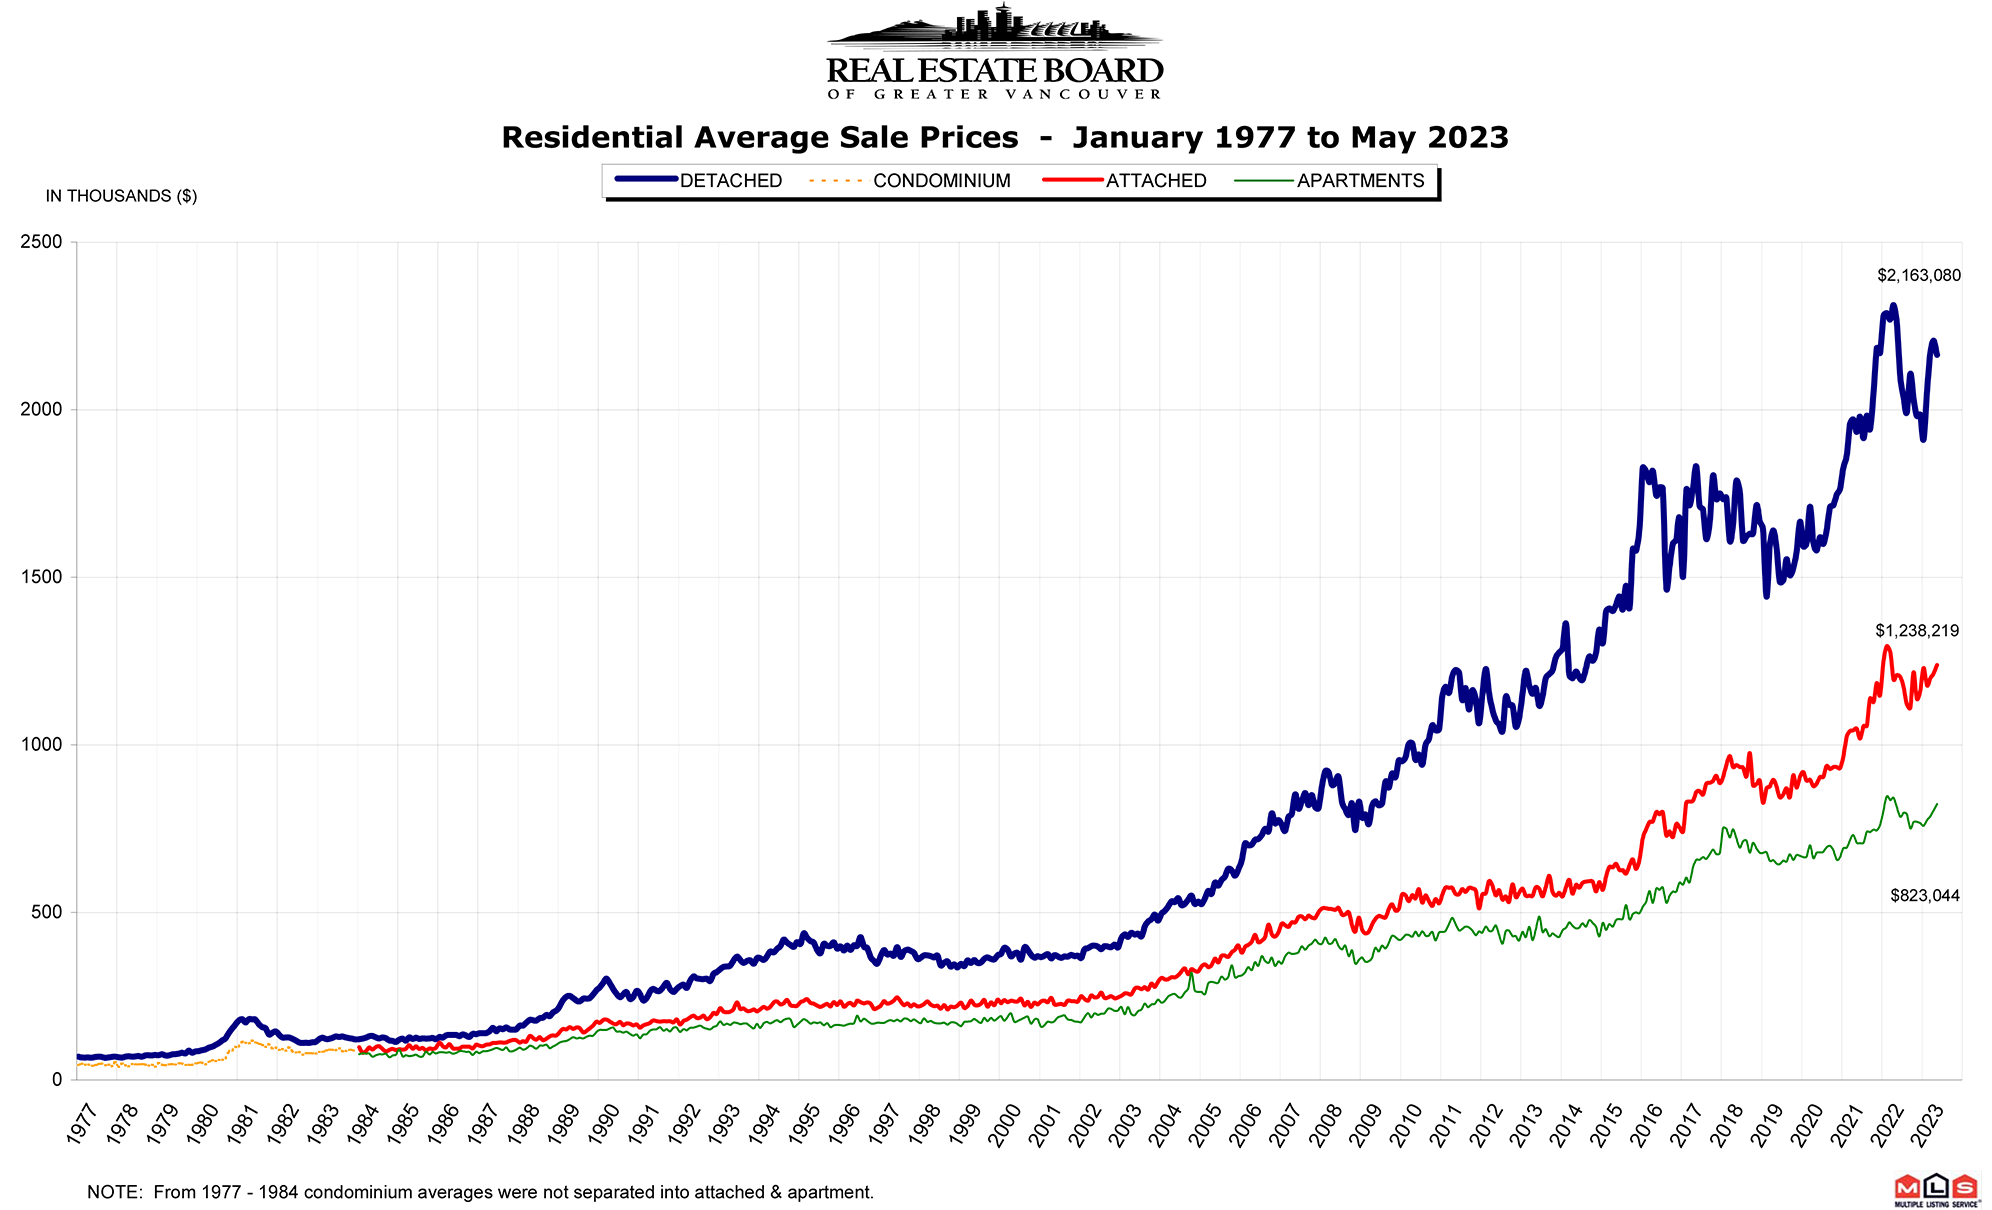
The MLS® Home Price Index composite benchmark price for all residential properties in Metro Vancouver is currently $1,170,700. This represents a 7.4 per cent decrease over April 2022 and a 2.4 per cent increase compared to March 2023.
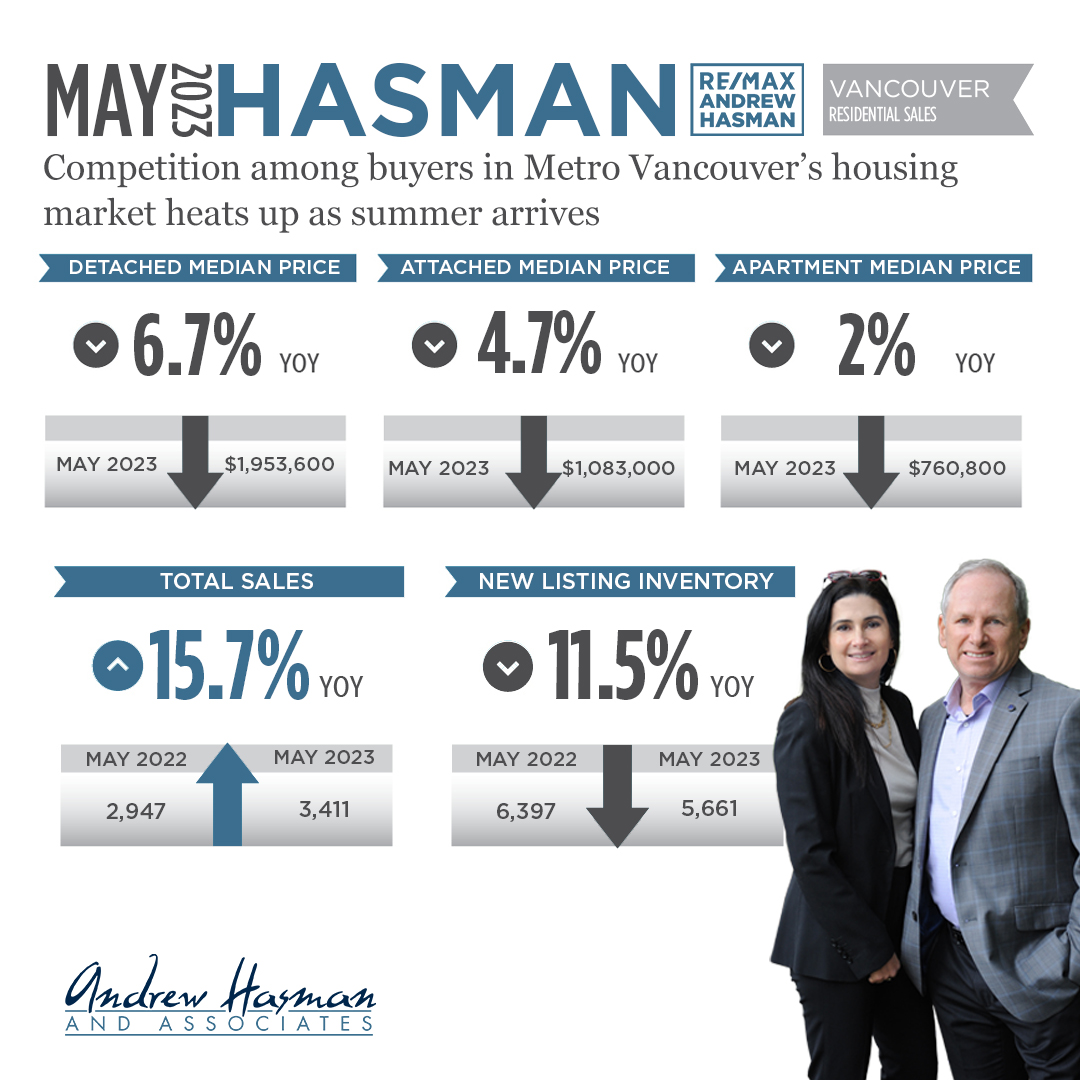
Sales of detached homes in April 2023 reached 808, a 16.3 per cent decrease from the 965 detached sales recorded in April 2022. The benchmark price for detached properties is $1,915,800. This represents an 8.8 per cent decrease from April 2022 and a 2.9 per cent increase compared to March 2023.
Sales of apartment homes reached 1,413 in April 2023, a 16.5 per cent decrease compared to the 1,693 sales in April 2022. The benchmark price of an apartment property is $752,300. This represents a 3.1 per cent decrease from April 2022 and a two per cent increase compared to March 2023.
Attached home sales in April 2023 totalled 500, a 13.5 per cent decrease compared to the 578 sales in April 2022. The benchmark price of an attached unit is $1,078,400. This represents a 6.1 per cent decrease from April 2022 and a 2.1 per cent increase compared to March 2023.