RSS

Competition among buyers in Metro Vancouver’s housing market heats up as summer arrives

VANCOUVER, BC – May 2, 2023 – With listing activity remaining below historical norms, home sales in Metro Vancouver1 have mounted a surprising comeback, rising near levels seen last spring, before eight consecutive interest rate hikes eroded borrowing power and brought home sales activity down along with it.


The Real Estate Board of Greater Vancouver (REBGV) reports that residential home sales in the region totalled 2,7412 in April 2023, a 16.5 per cent decrease from the 3,281 sales recorded in April 2022, and 15.6 per cent below the 10-year seasonal average (3,249).

“The fact we are seeing prices rising and sales rebounding this spring tells us home buyers are returning with confidence after a challenging year for our market, with mortgage rates roughly doubling,” Lis said. “The latest MLS HPI® data show home prices have increased about five per cent year-to-date, which already outpaces our forecast of one to two per cent by year-end. The year is far from over, however, and it remains to be seen if these price increases will be sustained into 2024.”


There were 4,307 detached, attached and apartment properties newly listed for sale on the Multiple Listing Service® (MLS®) in Metro Vancouver in April 2023. This represents a 29.7 per cent decrease compared to the 6,128 homes listed in April 2022, and was 22 per cent below the 10-year seasonal average (5,525).


The total number of homes currently listed for sale on the MLS® system in Metro Vancouver is 8,790, a 4.2 per cent decrease compared to April 2022 (9,176), and 20.9 per cent below the 10-year seasonal average (11,117).


Across all detached, attached and apartment property types, the sales-to-active listings ratio for April 2023 is 32.7 per cent. By property type, the ratio is 24.4 per cent for detached homes, 40.1 per cent for townhomes, and 37.4 per cent for apartments.


Analysis of the historical data suggests downward pressure on home prices occurs when the ratio dips below 12 per cent for a sustained period, while home prices often experience upward pressure when it surpasses 20 per cent over several months.

“When we released our market forecast in January, we were one of the only organizations taking the contrarian view that prices were likely to appreciate in 2023,” Lis said. “And what we’re seeing unfold so far this year is consistent with our prediction that near record-low inventory levels would create competitive conditions where almost any resurgence in demand would translate to price escalation, despite the elevated borrowing cost environment. At the crux of it, the issue remains a matter of far too little resale supply available relative to the pool of active buyers in our market.”


The MLS® Home Price Index composite benchmark price for all residential properties in Metro Vancouver is currently $1,170,700. This represents a 7.4 per cent decrease over April 2022 and a 2.4 per cent increase compared to March 2023.


Sales of detached homes in April 2023 reached 808, a 16.3 per cent decrease from the 965 detached sales recorded in April 2022. The benchmark price for detached properties is $1,915,800. This represents an 8.8 per cent decrease from April 2022 and a 2.9 per cent increase compared to March 2023.


Sales of apartment homes reached 1,413 in April 2023, a 16.5 per cent decrease compared to the 1,693 sales in April 2022. The benchmark price of an apartment property is $752,300. This represents a 3.1 per cent decrease from April 2022 and a two per cent increase compared to March 2023.


Attached home sales in April 2023 totalled 500, a 13.5 per cent decrease compared to the 578 sales in April 2022. The benchmark price of an attached unit is $1,078,400. This represents a 6.1 per cent decrease from April 2022 and a 2.1 per cent increase compared to March 2023.

Read

Competition among buyers in Metro Vancouver’s housing market heats up as summer arrives

While the year started slower than usual, Metro Vancouver’s housing market is showing signs of heating up as summer arrives, with prices increasing for the sixth consecutive month.

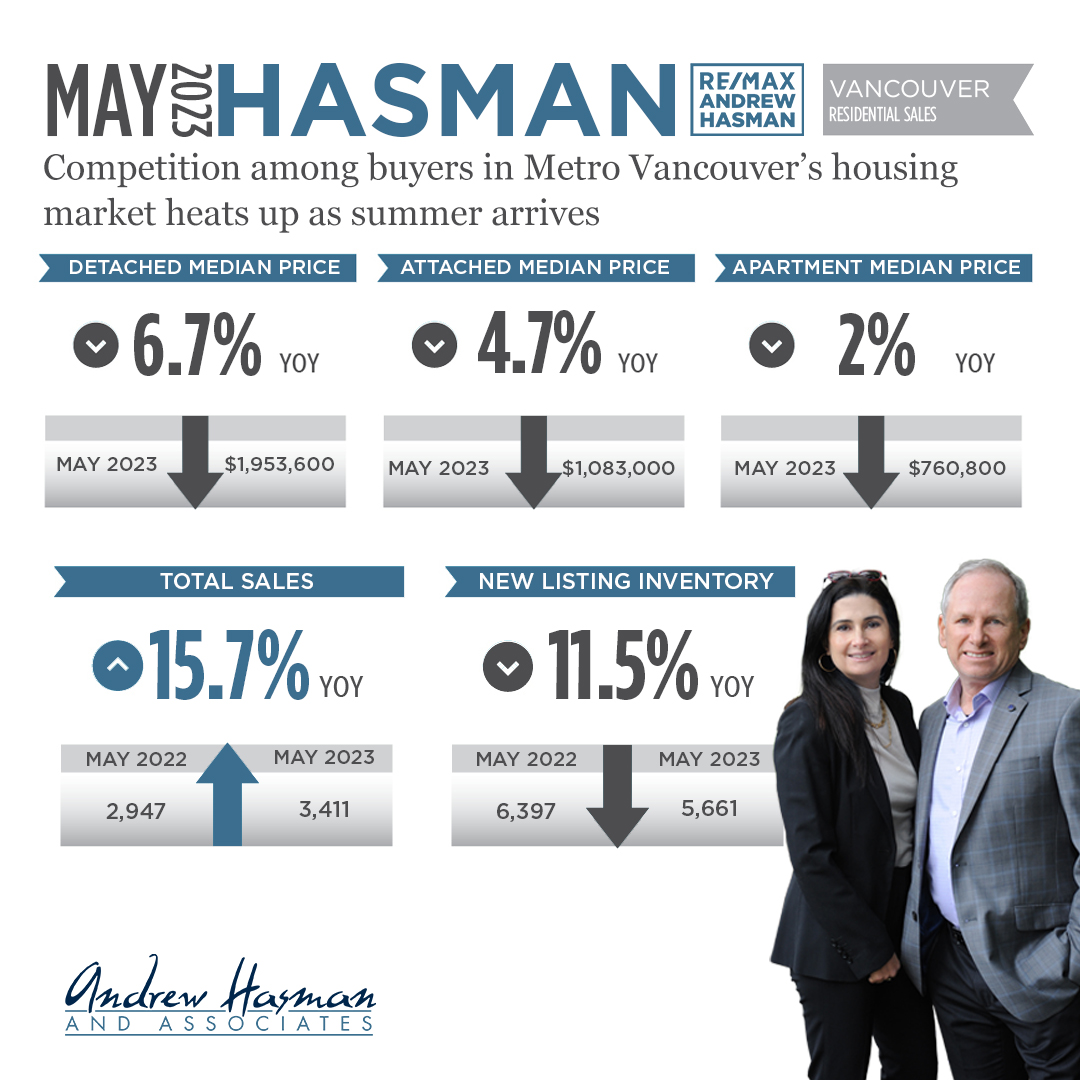
The Real Estate Board of Greater Vancouver (REBGV) reports that residential home sales in the region totalled 3,411 in May 2023, which is a 15.7 per cent increase from the 2,947 sales recorded in May 2022, and a 1.4 per cent decline from the 10-year seasonal average (3,458).

“Back in January, few people would have predicted prices to be up as much as they are – ourselves included,” Andrew Lis, REBGV’s director of economics and data analytics said. “Our forecast projected prices to be up modestly in 2023 by about two per cent at year-end. Instead, Metro Vancouver home prices are already up about six per cent or more across all home types at the midway point of the year.”

There were 5,661 detached, attached and apartment properties newly listed for sale on the Multiple Listing Service® (MLS®) in Metro Vancouver in May 2023. This represents an 11.5 per cent decrease compared to the 6,397 homes listed in May 2022, and was 4.3 per cent below the 10-year seasonal average (5,917).

The total number of homes currently listed for sale on the MLS® system in Metro Vancouver is 9,293, a 10.5 per cent decrease compared to May 2022 (10,382), and 20.6 per cent below the 10-year seasonal average (11,705).

Across all detached, attached and apartment property types, the sales-to-active listings ratio for May 2023 is 38.4 per cent. By property type, the ratio is 28.5 per cent for detached homes, 45 per cent for townhomes, and 45.5 per cent for apartments.

Analysis of the historical data suggests downward pressure on home prices occurs when the ratio dips below 12 per cent for a sustained period, while home prices often experience upward pressure when it surpasses 20 per cent over several months.

“You don’t have to squint to see the reason prices continue to increase. The fundamental issue remains that there are more buyers relative to the number of willing sellers in the market. This is keeping the amount of resale homes available in short supply,” Lis said. “And in a surprising twist, MLS® sales in May snapped back closer to historical averages than we’ve seen in the recent past, despite mortgage rates being where they are now, and new listing activity having been slower than usual this spring. If mortgage rates weren’t holding back market activity so much right now, I think our market would look a lot like the heydays of 2021/22, or even 2016/17.”

The MLS® Home Price Index composite benchmark price for all residential properties in Metro Vancouver is currently $1,188,000. This represents a 5.6 per cent decrease over May 2022 and a 1.3 per cent increase compared to April 2023.

Sales of detached homes in May 2023 reached 1,043, a 30.7 per cent increase from the 798 detached sales recorded in May 2022. The benchmark price for a detached home is $1,953,600. This represents a 6.7 per cent decrease from May 2022 and a 1.8 per cent increase compared to April 2023.

Sales of apartment homes reached 1,730 in May 2023, a 7.9 per cent increase compared to the 1,604 sales in May 2022. The benchmark price of an apartment home is $760,800. This represents a two per cent decrease from May 2022 and a 1.1 per cent increase compared to April 2023.

Attached home sales in May 2023 totalled 608, a 16.7 per cent increase compared to the 521 sales in May 2022. The benchmark price of an attached home is $1,083,000. This represents a 4.7 per cent decrease from May 2022 and a 0.2 per cent increase compared to April 2023.


Read


The 2017 Metro Vancouver real estate market opened at 10.3% below the 10-year sales average for January.


“From a real estate perspective, it’s a lukewarm start to the year compared to 2016,” said Real Estate Board of Greater Vancouver president Dan Morrison. “While we saw near record-breaking sales at this time last year, home buyers and sellers are more reluctant to engage so far in 2017.”


1,523 residential properties sold last month, a 39.5% decrease from the 2,519 sales in January 2016 and a 11.1% decrease from the 1,714 sold in December 2016.


Property type is proving to be a key factor as townhome and condominiums continue to be active markets while detached homes are declining in popularity by about 7% since their peak last July.

An in-depth look at January 2017 Sales:

The 2017 Metro Vancouver real estate market opened at 10.3% below the 10-year sales average for January.


“From a real estate perspective, it’s a lukewarm start to the year compared to 2016,” said Real Estate Board of Greater Vancouver president Dan Morrison. “While we saw near record-breaking sales at this time last year, home buyers and sellers are more reluctant to engage so far in 2017.”

1,523 residential properties sold last month, a 39.5% decrease from the 2,519 sales in January 2016 and a 11.1% decrease from the 1,714 sold in December 2016.

Property type is proving to be a key factor as townhome and condominiums continue to be active markets while detached homes are declining in popularity by about 7% since their peak last July.

An in-depth look at January 2017 Sales:

New Listings (detached, attached, and apartment): 4,140
6.8% decrease from January 2016
215.5% increase from December 2016


Total Active listings on MLS®: 7,238
9.1% increase from January 2016
14.1% increase from December 2016


Sales-to-Active Listings Ratio: 21%


Benchmark price for all residential properties: $896,000
0.2% decrease from December 2016


Benchmark price for a detached property is $1,474,800
6.6% decline over the past 6 months
0.6% decrease from December 2016


Detached property sales totaled 444
57.6% decrease from January 2016


Benchmark price for an apartment property is $512,300
0.3% increase over the past 6 month
0.4% increase from December 2016


Apartment property sales totaled 825
24.7% decrease from January 2016


Benchmark price for an attached unit is $666,500
0.4% decrease over the past 6 months
0.7% increase from December 2016


Attached property sales totaled 254
32.4% decrease from January 2016


For a complete comparison, visitrebgv.org. Want to sell, buy, or require a consultation? Contact us today!


*REBGV Editor’s Note:  Areas covered by the Real Estate Board of Greater Vancouver include: Whistler, Sunshine Coast, Squamish, West Vancouver, North Vancouver, Vancouver, Burnaby, New Westminster, Richmond, Port Moody, Port Coquitlam, Coquitlam, Pitt Meadows, Maple Ridge, and South Delta.


Read

The latest numbers for the September 2016 market are available from the Real Estate Board of Greater Vancouver. Below are snapshots of the Vancouver East and Vancouver West real estate market statistics. The full reports are available in PDF form for download.


Download the full reports:

Vancouver East

Vancouver West

Read


Summer started below recent averages in the Vancouver real estate market, and registered home sales were below 4,000 for the first time since January. The Real Estate Board of Greater Vancouver’s president Dan Morrison stated that after a record-breaking start to the year, home-buyer demand returned to more “normal” levels in-line with previous years.


“We’ll wait and watch over the next few months to see if this marks the return of more normal market trends.” Morrison concluded, as July’s sales were still 6.5% above the 10-year sales average for the month. And with the recent introduction of the new BC Foreign Buyer’s Tax by the Canadian government, only time will tell what’s in store for the Vancouver market.


July 2016 By The Numbers:


New Listings (detached, attached, and apartment): 5,241
2.5% increase from July 2015
10.8% decrease from June 2016


Total Active listings on MLS®: 8,351
27.4% decline from July 2015
6.9% increase from June 2016


Sales-to-Active-Listings ratio: 38.6%


Benchmark price for all residential properties: $930,400
32.6% increase from July 2015


Benchmark price for a detached property is $1,578,300
38% increase from July 2015


Detached property sales totaled 1,077
30.9% decrease from July 2015


Benchmark price for an apartment property is $510,600
27.4% increase from July 2015


Apartment property sales totaled 1,602
7.3% decrease from July 2015


Benchmark price for an attached unit is $669,000
29.4% increase from July 2015


Attached property sales totaled 547
20.7% decrease from July 2015


For a complete comparison, visit rebgv.org. Want to sell, buy, or require a consultation? Contact me today.


*REBGV Editor’s Note:  Areas covered by Real Estate Board of Greater Vancouver include: Whistler, Sunshine Coast, Squamish, West Vancouver, North Vancouver, Vancouver, Burnaby, New Westminster, Richmond, Port Moody, Port Coquitlam, Coquitlam, New Westminster, Pitt Meadows, Maple Ridge, and South Delta.

Read

January 2016 is the second highest start to the year on record with sales 46% above the 10-year average for the month. Low supply and record-breaking buyer demand is still the driving force in the real estate market.


The total number of residential sales in the Greater Vancouver area totalled 2,519 for the month; a 31.7% increase from the 1,913 sales in January 2015. It was only a slight, 10.9% decline from the 2,827 sales in December 2015.


Real Estate Board of Greater Vancouver’s president Darcy McLeod touts the importance of listing your home with MLS® to ensure maximum exposure. For home buyers, MLS®  is the second greatest tool next to an excellent realtor. With so much competition out there, keeping a constant eye on MLS®  gives buyers the best chance to snapping up the home of their dreams.


2016 Opening Numbers:

New Listings (detached, attached, and apartment) in January: 4,442
6.2% decline from January 2015

119.8% increase from December 2015


Total Active listings on MLS®: 6,635
38.6% decline from January 2015
10.1% increase from December 2015


Sales-to-Active-Listings ratio: 38%

Benchmark price for a detached property is $1,293,700
27.9% increase from January 2015


Detached property sales totaled 1,047
34.1% increase from January 2015


Benchmark price for an apartment property is $456,600
19.4% increase from January 2015


Apartment property sales totaled 1,096
35.5% increase from January 2015


Benchmark price for an attached unit is $563,700
16.4% increase from January 2015


Attached property sales totaled 376
16.4% increase from January 2015


For a complete comparison, visit rebgv.org. Want to sell, buy, or require a consultation? Contact me today.


*REBGV Editor’s Note:  Areas covered by Real Estate Board of Greater Vancouver include: Whistler, Sunshine Coast, Squamish, West Vancouver, North Vancouver, Vancouver, Burnaby, New Westminster, Richmond, Port Moody, Port Coquitlam, Coquitlam, New Westminster, Pitt Meadows, Maple Ridge, and South Delta.


(Photo: explore604)


Read


REBGV graph Nov 2015


Demand keeps rising for the diminishing supply of homes on the Vancouver market. Despite being a historically slower month, November’s numbers only dipped by 3.3% since October and closed at the highest they’ve been for residential property sales in 9 years, as well as the second highest on record (46.2% above the 10-year sales average). According to MLS®, there were 3,524 sales in Metro Vancouver; a 40.1% increase compared to the 2,516 sales in November 2014.


Working with a realtor has never been so important as it is in the current state of the market. To compete with the high demand and fewer housing choices, fully understanding the options out there is where your realtor is an invaluable resource. “Demand remains strong and there are housing options at different price points throughout the region,” affirms the Real Estate Board of Greater Vancouver’s president Darcy McLeod.


To give you an idea of how this record-breaking month came to pass, here’s November by the numbers:

New Listings (detached, attached, and apartment) for November: 3,392
12.5% increase from November 2014


Total Active listings on MLS®: 8,096
35% decline from November 2014


Sales-to-Active-Listings ratio: 43.5%


Benchmark price for all residential properties in Metro Vancouver is $752,500
17.8% increase from November 2014


Benchmark price for a detached property is $1,226,300
22.6% increase from November 2014


Detached property sales totaled 1,335
31.9% since November 2014 and 44.2% since November 2013


Benchmark price for an apartment property is $435,000
14% increase from November 2014


Apartment property sales totaled 1,553
47.6% increase from November 2014


Benchmark price for an attached unit is $536,600
11.3% increase from November 2014


Attached property sales totaled 636
40.7% increase from November 2014


For a complete comparison, visit rebgv.org. Want to sell, buy, or require a consultation? Contact me today.


*REBGV Editor’s Note:  Areas covered by Real Estate Board of Greater Vancouver include: Whistler, Sunshine Coast, Squamish, West Vancouver, North Vancouver, Vancouver, Burnaby, New Westminster, Richmond, Port Moody, Port Coquitlam, Coquitlam, New Westminster, Pitt Meadows, Maple Ridge, and South Delta.


Read

fall vancouver 2015


Selling a home? MLS reported 3,646 sales; a 19.3% increase compared to October 2014 (3,057), and a 9% increase to September sales of this year (3,345). That’s 36.2% above the 10-year sales average for the month of October.


Buying a home? Patience, deep pockets, and the right realtor that knows the market and how to make an acceptable offer will ensure you a spot in the game. Darcy McLeod, Real Estate Board of Greater Vancouver’s president, said that “Home sales are more than one-third above what’s typical for this time of year, yet the supply of homes for sale is the lowest we’ve seen in five years.” That also indicates that when you do find the home of your dreams, having your financing lined-up and limited conditions can make all the difference.


The market at a glance:


October 2015 Active listings: 4,126
8% decline from the reported 4,487 active listings in October 2014


Total number of properties for sale: 9,569
30% decline from October 2014, and an 11.4% decline from September 2015


Sales-to-Active-Listings ratio: 38.1%
Benchmark price for all residential properties in Metro Vancouver is $736,000

15.3% increase from October 2014


Benchmark price for a detached property is $1,197,600
20.1% increase from October 2014


Detached property sales totaled 1,437
13.1% increase from October 2014’s 1,271 sales


Benchmark price for an apartment property is $425,800
11.4% increase from October 2014


Apartment property sales totaled 1,543
21.7% increase from October 2014’s 1,268 sales


Benchmark price for an attached unit is $526,700
9.3% increase from October 2014


Attached property sales totaled 666
28.6% increase from October 2014’s 518 sales


The Greater Vancouver Area’s market is in the home seller's favour as residential property sales numbers continue their steady climb. For a complete comparison, visit rebgv.org. Want to sell, buy, or require a consultation? Call us at 604-657-7936 or email Andrew at andrew@andrewhasman.com!


*REBGV Editor’s Note: Areas covered by Real Estate Board of Greater Vancouver include: Whistler, Sunshine Coast, Squamish, West Vancouver, North Vancouver, Vancouver, Burnaby, New Westminster, Richmond, Port Moody, Port Coquitlam, Coquitlam, New Westminster, Pitt Meadows, Maple Ridge, and South Delta.


(Photo: Jennifer C.)

Read

Vancouver West Side Downtown

As a key economic driver in BC, the real estate market is happily humming along in our fair city. There was a 14.5% increase in residential property sales this September; 3,345 compared to the 2,922 sales reported in September 2014. This is only a slight 0.5% decrease to August 2015 sales.


Let’s review the Real Estate Board of Greater Vancouver’s September Stats as a big picture. Knowing where your homes stands in the grand scheme of Vancouver’s market will help you prepare to sell it, or know what’s a good buy and what isn’t. 


September sales were 32.9% above the 10-year average, even though the total number of properties for sale listed on MLS® was 27% less than September 2014, and .8% less than August 2015.


Sales-to-Active-Listings ratio: 31%


Benchmark price for all residential properties in Metro Vancouver is $722,300

A 13.7% increase from September 2014


Detached property sales totaled 1,272; a 0.2% increase from September 2014
Benchmark price for a detached property is $1,179,700


Apartment property sales totaled 1,529; a 28.7% increase from September 2014
Benchmark price for an apartment property is $415,100


Attached property sales totaled 544; a 17.2% increase from September 2014
Benchmark price for an attached unit is $518,600


“Residential home sales have been trending at 25 to 30 per cent about the ten-year sales average for most of the year. The number of homes listed for sale hasn’t been keeping up the demand,” Darcy McLeod, REBGV president said. “It’s this dynamic that’s placing upward pressure on home prices, particularly in the detached home market.”


Fall continues to favour home sellers across Metro Vancouver’s housing market! Call us at 604-657-7936 to make an appointment so we can help you on your journey. For the full September Stats details, visit REBGV.


*REBGV Editor’s Note:  Areas covered by Real Estate Board of Greater Vancouver include: Whistler, Sunshine Coast, Squamish, West Vancouver, North Vancouver, Vancouver, Burnaby, New Westminster, Richmond, Port Moody, Port Coquitlam, Coquitlam, New Westminster, Pitt Meadows, Maple Ridge, and South Delta.


(Photo: Alex Costin)

Read

The gloriously lazy days of summer are slowly drawing to an end, which means if you’re still thinking of putting your house up for sale in 2015, now’s the time to prepare. From choosing the right time to put up that For Sale sign to staging, hiring an agent, and all the other important details involved in ensuring a successful sale; it’s best to organize your “To Do” list as early as possible. Things happen, not always good; so if there’s plenty of time to meet them head-on you’ll come out on top.


To get you started, we’ve got the Real Estate Board of Greater Vancouver’s Summer Stats. Knowing where the market stands and how your home compares is the first step in preparing to sell. Next step? Call us to make an appointment so we can help you on your journey.


July saw more than a third of Metro Vancouver sales above the 10-year average, even though the number of properties up for sale continues to trend below average.


It’s still a seller’s market out there: new listings in July totaled 5,112. That’s a 3.8% increase from July 2014. However, the total number of properties for sale is 11,505: a 26.3% decline from July 2014 and a 5.5% decline from June 2015.


The MLS® Home Price Index composite benchmark price for all residential properties in Metro Vancouver is currently $700,500. That’s an 11.2% increase from the previous year.


Sales-to-Active-Listings ratio: 34.6%


Detached property sales totaled 1,559; a 17.9% increase from July 2014
Benchmark price for a detached property is $1,141,800


Apartment property sales totaled 1,729; a 42.7% increase from July 2014
Benchmark price for an apartment property is $400,900


Attached property sales totaled 690; a 30.9% increase from July 2014
Benchmark price for an attached unit is $511,500


REBGV president Darcy McLeod suggests these numbers are due to “strong consumer confidence, low interest rates, and a reduced supply of homes for sale.” McLeod also makes the point that “the diversity of housing options is part of what’s driving today’s demand.”


For a more complete picture, visit rebgv.org. Then let us know your thoughts on the market! Think these numbers can continue to reach sky-high in our beautiful city?


Contact us for a consultation today.


*REBGV Editor’s Note:  Areas covered by Real Estate Board of Greater Vancouver include: Whistler, Sunshine Coast, Squamish, West Vancouver, North Vancouver, Vancouver, Burnaby, New Westminster, Richmond, Port Moody, Port Coquitlam, Coquitlam, New Westminster, Pitt Meadows, Maple Ridge, and South Delta.
Read


The June 2015 numbers from The Real Estate Board of Greater Vancouver are record-setting. It was the highest selling June on record.


The month saw residential property sales exceed 4,300, which is a whopping 28% more than that of June 2014. These numbers surpassed those seen in May. June 2015 also hit another high: four straight months with more than 4,000 sales per month.


These numbers signal a lot of positives for sellers. Many people believe that summer isn’t the best time to sell, but because most people take their property off the market, inventory becomes scarce and sellers can often see multiple offers and a quick sale. we are seeing some great inventory right now.


It’s also the ideal time to prepare for the fall market. We are available to consult with potential sellers and offer suggestions for staging, repairs or other issues a seller might not have considered. We have a list of pros to help get any place into top selling shape.


We also understand the additional pressure buyers struggle with in a competitive market. Many buyers feel the need to make major decisions in a rush, and that can be problematic. The current high demand for housing is further extended by the recent cut in interest rates, along with an expanding population base and a decrease in supply of detached homes.


We’re great at handling such complex scenarios to help potential buyers understand what they need to know in a stressful, often rapid-fire situation. We use our deep insight into the local market, dexterity with MLS listings and expertise in buying strategies to ensure your success.


At Andrew Hasman and Associates, buying or selling your home in Vancouver's Westside doesn't get any better than this. Reach out to us at 604-657-7936 or email andrew@andrewhasman.com.

Read

Over the past 2 decades we have spoken with thousands of homeowners only to learn that so many have had a negative experience when dealing with a real estate agent. So many buyers & sellers make the mistake of hiring a REALTOR® based on the wrong selection criteria. Many only interview one agent.


Selling a home is probably one of the most important and biggest dollar value transactions the average person will ever enter into. You’d think it would only make sense to hire a seasoned professional to navigate your sale.


Before selecting your REALTOR® to help you in your next real estate transaction here are a few tips to ensure you make the right decision.


Firstly, it’s always wise to speak with 3 REALTORS® to ensure what you are hearing makes sense. Some questions to ask:


1. How many sales do they have in the immediate neighborhood where you are buying or selling. It always makes sense to select a REALTOR® who works in your neighborhood.

2. How many listings and or how many buyers are they presently working with. A REALTOR® with 20 or more active listing may to be busy to provide you with the service you expect.

3. How many associates does the REALTOR® have working with them? If your agent is part of a team who’s the one will you be dealing with. Who will be showing your home? Is it important for you to have your agent showing up to show the home & be present at open houses? If they cannot commit chances are you are going to have an assistant show your home. Are you ok with that?

4. Ask your agent if they are planning on taking any vacation time during your listing period. While everyone deserves a vacation I think it’s important to know whether their vacation will take place while you are selling your home.


Does your agent live in the neighborhood or in close proximity to where you are buying or selling. Hiring a REALTOR® who is not knowledgeable about property values in your area can cost you big time. Don’t list or buy with a friend who lives 25 miles away. Have them refer you to a local agent.


Asking a few simple questions can ensure you a better outcome when selling or buying your next property.


Happy Selling,


Andrew & Jill Hasman

Read
Reciprocity Logo The data relating to real estate on this website comes in part from the MLS® Reciprocity program of either the Greater Vancouver REALTORS® (GVR), the Fraser Valley Real Estate Board (FVREB) or the Chilliwack and District Real Estate Board (CADREB). Real estate listings held by participating real estate firms are marked with the MLS® logo and detailed information about the listing includes the name of the listing agent. This representation is based in whole or part on data generated by either the GVR, the FVREB or the CADREB which assumes no responsibility for its accuracy. The materials contained on this page may not be reproduced without the express written consent of either the GVR, the FVREB or the CADREB.