Posted on
August 3, 2023
by
Andrew Hasman
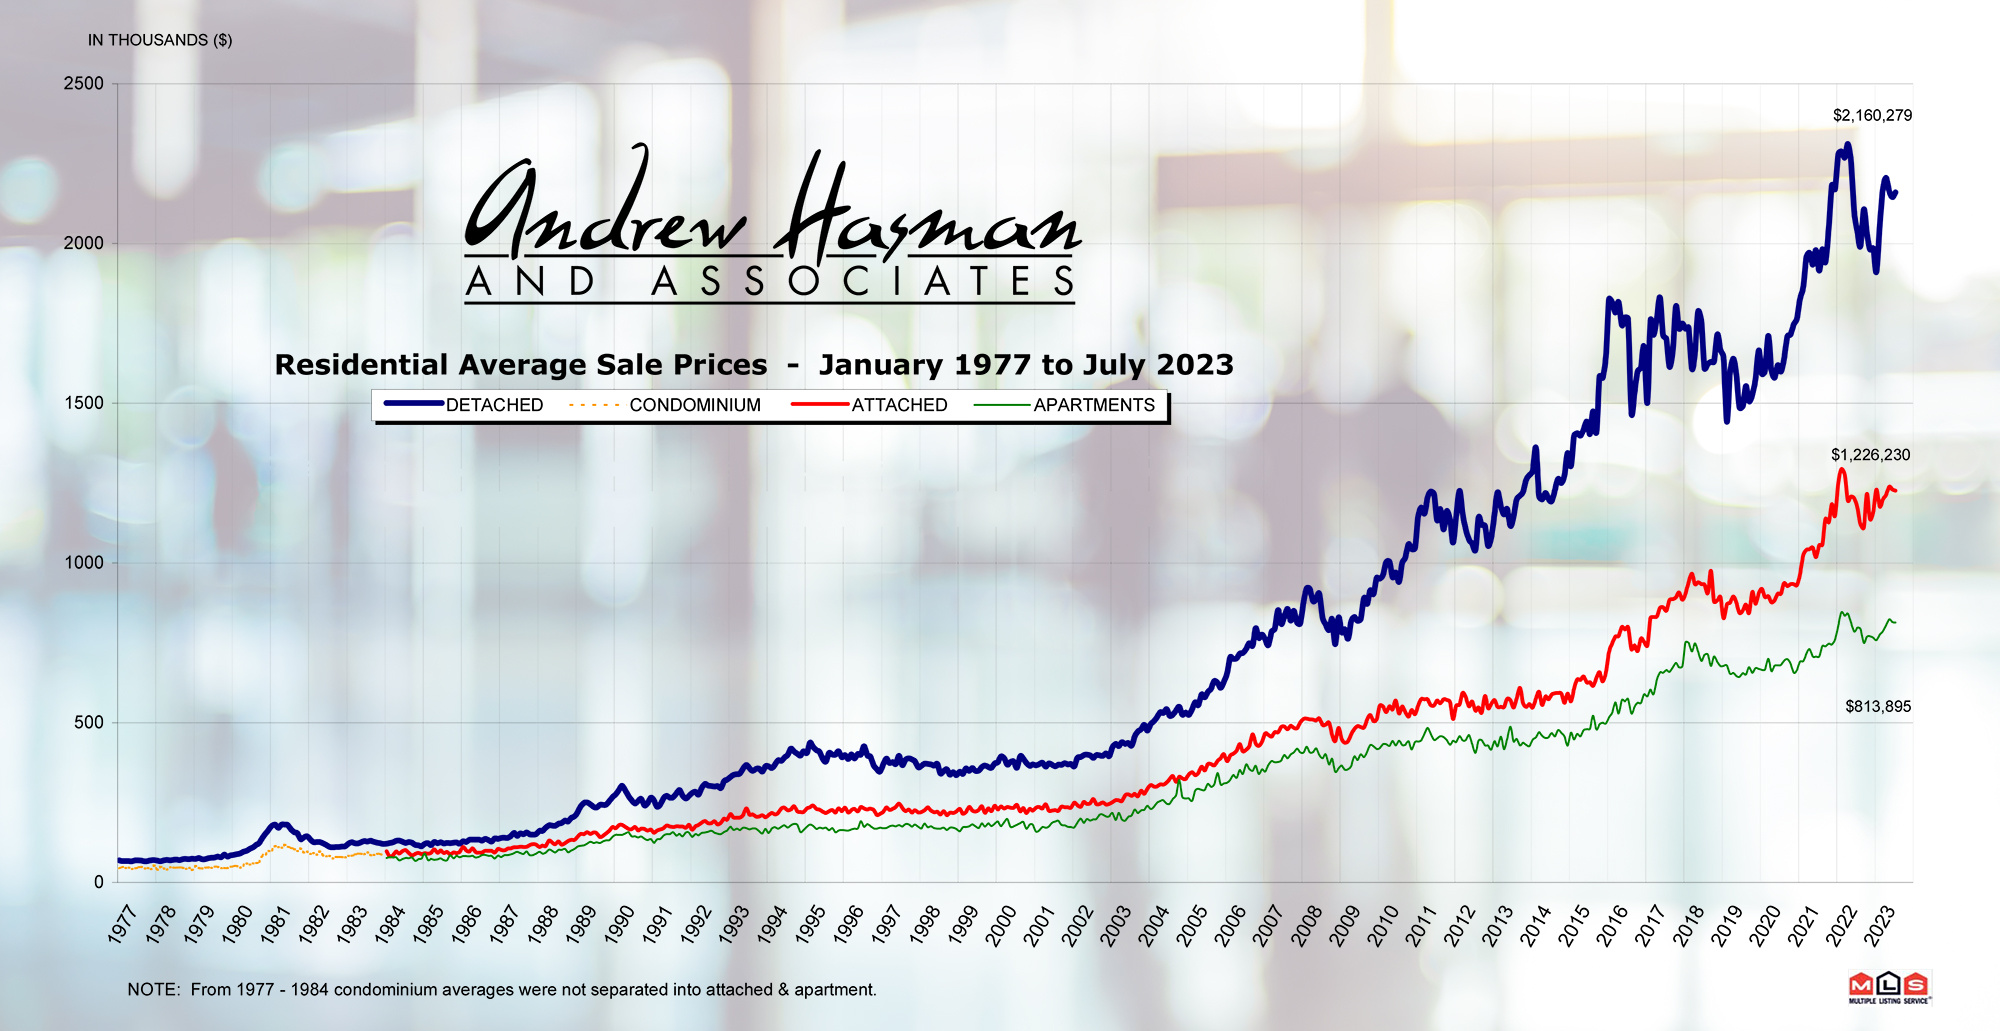
Home prices across all home types in Metro Vancouver1 rose again in July, as strong sales figures continue to push up against low levels of housing inventory in the region.
The Real Estate Board of Greater Vancouver (REBGV) reports that residential home sales in the region totalled 2,455 in July 2023, a 28.9 per cent increase from the 1,904 sales recorded in July 2022. This was 15.6 per cent below the 10-year seasonal average (2,909).
“While sales remain about 15 per cent below the ten-year average, they are also up about 30 per cent year-over-year, which is not insignificant,” Andrew Lis, REBGV’s director of economics and data analytics said. “Looking under the hood of these figures, it’s easy to see why sales are posting such a large year-over-year percentage increase. Last July marked the point when the Bank of Canada announced their ‘super-sized’ increase to the policy rate of one full per cent, catching buyers and sellers off guard, and putting a chill on market activity at that time.”
There were 4,649 detached, attached and apartment properties newly listed for sale on the Multiple Listing Service® (MLS®) in Metro Vancouver in July 2023. This represents a 17 per cent increase compared to the 3,975 homes listed in July 2022. This was 5.2 per cent below the 10-year seasonal average (4,902).
The total number of homes currently listed for sale on the MLS® system in Metro Vancouver is 10,301, a four per cent decrease compared to July 2022 (10,734). This was 14.4 per cent below the 10-year seasonal average (12,039).
Across all detached, attached and apartment property types, the sales-to-active listings ratio for July 2023 is 24.9 per cent. By property type, the ratio is 16.5 per cent for detached homes, 32 per cent for townhomes, and 30.6 per cent for apartments.
Analysis of the historical data suggests downward pressure on home prices occurs when the ratio dips below 12 per cent for a sustained period, while home prices often experience upward pressure when it surpasses 20 per cent over several months.
“What’s interesting to see in the current market environment is that, while the Bank of Canada rate hike this July was only a quarter of a per cent, mortgage rates are now at the highest levels we’ve seen in Canada in over ten years,” Lis said. “Yet despite borrowing costs being even higher than last July, sales activity surpassed the levels we saw last year, which I think says a lot about the strength of demand in our market and buyers’ ability to adapt to and qualify for higher borrowing costs.”
The MLS® Home Price Index composite benchmark price for all residential properties in Metro Vancouver is currently $1,210,700. This represents a 0.5 per cent increase over July 2022 and a 0.6 per cent increase compared to June 2023.
Sales of detached homes in July 2023 reached 681, a 28.7 per cent increase from the 529 detached sales in July 2022. The benchmark price for a detached home is $2,012,900. This represents a 0.6 per cent increase from July 2022 and a 1.1 per cent increase compared to June 2023.
Sales of apartment homes reached 1,281 in July 2023, a 20.7 per cent increase compared to the 1,061 sales in July 2022. The benchmark price of an apartment home is $771,600. This represents a 2.6 per cent increase from July 2022 and a 0.6 per cent increase compared to June 2023.
Attached home sales in July 2023 totalled 466, a 53.3 per cent increase compared to the 304 sales in July 2022. The benchmark price of an attached home is $1,104,600. This represents a 1.2 per cent increase from July 2022 and a 0.5 per cent increase compared to June 2023.
GET THE FULL REPORT