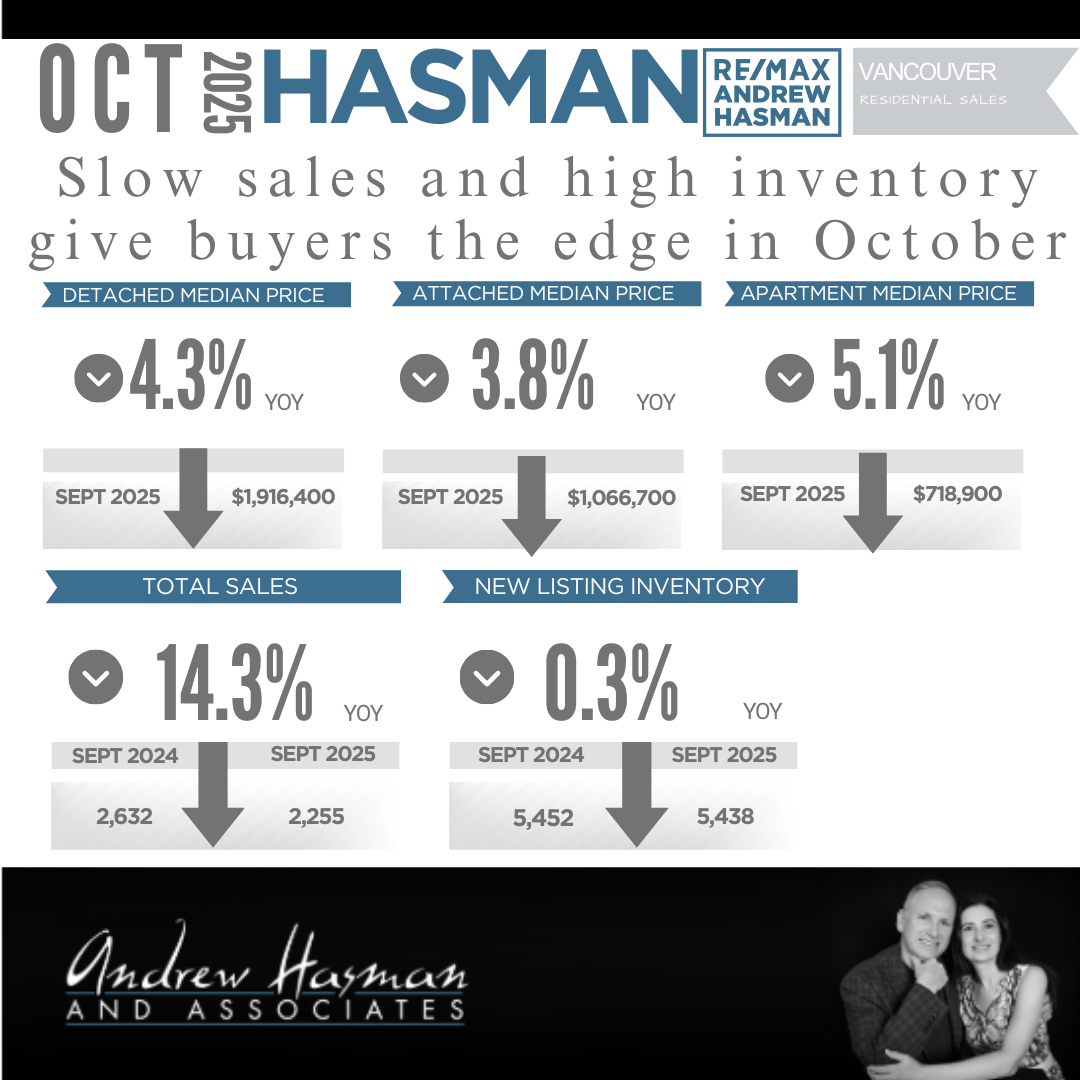
RSS

Home sellers awaken this spring, bringing much-needed inventory to the housing market

While Metro Vancouver home sellers appeared somewhat hesitant in January, new listings rose 31 per cent year-over-year in February, bringing a significant number of newly listed properties to the market.

Greater Vancouver REALTORS® (GVR)(*2) reports that residential sales(*3) in the region totalled 2,070 in February 2024, a 13.5 per cent increase from the 1,824 sales recorded in February 2023. This was 23.3 per cent below the 10-year seasonal average (2,699).

“While the pace of home sales started the year off briskly, the pace of newly listed properties in January was slower by comparison. A continuation of this pattern in February would have been concerning, as it could quickly tilt the market towards overheated conditions,” Andrew Lis, GVR’s director of economics and data analytics said. “With new listings up about 31 per cent year-over-year in February, this will relieve some of the pressure that was building in January and offer buyers more choice as we enter the spring and summer markets.”

There were 4,560 detached, attached and apartment properties newly listed for sale on the Multiple Listing Service® (MLS®) in Metro Vancouver in February 2024. This represents a 31.1 per cent increase compared to the 3,478 properties listed in February 2023. This was 0.2 per cent below the 10-year seasonal average (4,568).

The total number of properties currently listed for sale on the MLS® system in Metro Vancouver is 9,634, a 16.3 per cent increase compared to February 2023 (8,283). This is three per cent above the 10-year seasonal average (9,352).

Across all detached, attached and apartment property types, the sales-to-active listings ratio for February 2024 is 22.4 per cent. By property type, the ratio is 16 per cent for detached homes, 27.9 per cent for attached, and 25.9 per cent for apartments.

Analysis of the historical data suggests downward pressure on home prices occurs when the ratio dips below 12 per cent for a sustained period, while home prices often experience upward pressure when it surpasses 20 per cent over several months.

“Even with the increase in new listings however, standing inventory levels were not high enough relative to the pace of sales to mitigate price acceleration in February, with most segments of the market moving into sellers’ territory,” Lis said. “This competitive dynamic has led to modest price growth across all market segments this month, but it’s noteworthy that benchmark prices remain below the peak observed in the spring of 2022, before the market internalized the full effect of the Bank of Canada’s tightening cycle.”

The MLS® Home Price Index composite benchmark price for all residential properties in Metro Vancouver is currently $1,183,300. This represents a 4.5 per cent increase over February 2023 and a 1.9 per cent increase compared to January 2024.

Sales of detached homes in February 2024 reached 560, an 8.3 per cent increase from the 517 detached sales recorded in February 2023. The benchmark price for a detached home is $1,972,400. This represents a 7.2 per cent increase from February 2023 and a 1.5 per cent increase compared to January 2024.

Sales of apartment homes reached 1,092 in February 2024, a 17.7 per cent increase compared to the 928 sales in February 2023. The benchmark price of an apartment home is $770,700. This represents a 5.6 per cent increase from February 2023 and a 2.5 per cent increase compared to January 2024.

Attached home sales in February 2024 totalled 403, a 10.1 per cent increase compared to the 366 sales in February 2023. The benchmark price of a townhouse is $1,094,700. This represents a 4.2 per cent increase from February 2023 and a 2.6 per cent increase compared to January 2024.

GET THE FULL REPORT

Read

Home sales across Metro Vancouver’s housing market off to strong start in 2024

While the Metro Vancouver1 market ended 2023 in balanced market territory, conditions in January began shifting back in favour of sellers as the pace of newly listed properties did not keep up with the volume of home sales.

The Real Estate Board of Greater Vancouver (REBGV) reports that residential sales2 in the region totalled 1,427 in January 2024, a 38.5 per cent increase from the 1,030 sales recorded in January 2023. This was 20.2 per cent below the 10-year seasonal average (1,788).

“It’s hard to believe that January sales figures came in so strong after such a quiet December, which saw many buyers and sellers delaying major decisions,” Andrew Lis, REBGV’s director of economics and data analytics said. “If sellers don’t step off the sidelines soon, the competition among buyers could tilt the market back into sellers’ territory as the available inventory struggles to keep pace with demand.”

There were 3,788 detached, attached and apartment properties newly listed for sale on the Multiple Listing Service® (MLS®) in Metro Vancouver in January 2024. This represents a 14.5 per cent increase compared to the 3,308 properties listed in January 2023. This was 9.1 per cent below the 10-year seasonal average (4,166).

The total number of properties currently listed for sale on the MLS® system in Metro Vancouver is 8,633, a 9.8 per cent increase compared to January 2023 (7,862). This is 0.3 per cent below the 10-year seasonal average (8,657).

Across all detached, attached and apartment property types, the sales-to-active listings ratio for January 2024 is 17.2 per cent. By property type, the ratio is 11.9 per cent for detached homes, 22.9 per cent for attached, and 19.9 per cent for apartments.

Analysis of the historical data suggests downward pressure on home prices occurs when the ratio dips below 12 per cent for a sustained period, while home prices often experience upward pressure when it surpasses 20 per cent over several months.

“Our 2024 forecast is calling for a two to three per cent increase in prices by the end of the year, which is largely the result of demand, once again, butting up against too little inventory,” Lis said.

“If the January figures are indicative of what the spring market has in store, our forecast may already be off to an overly conservative start. Markets can shift quickly, however, and we’ll watch the February numbers to see if these early signs of strength continue, or whether they’re a blip in the data.”

The MLS® Home Price Index composite benchmark price for all residential properties in Metro Vancouver is currently $1,161,300. This represents a 4.2 per cent increase over January 2023 and a 0.6 per cent decrease compared to December 2023.

Sales of detached homes in January 2024 reached 379, a 28 per cent increase from the 296 detached sales recorded in January 2023. The benchmark price for a detached home is $1,942,400. This represents a 7.3 per cent increase from January 2023 and a 1.1 per cent decrease compared to December 2023.

Sales of apartment homes reached 746 in January 2024, a 30.6 per cent increase compared to the 571 sales in January 2023. The benchmark price of an apartment home is $751,900. This represents a 4.4 per cent increase from January 2023 and a 0.1 per cent increase compared to December 2023.

Attached home sales in January 2024 totalled 285, a 82.7 per cent increase compared to the 156 sales in January 2023. The benchmark price of a townhouse3 is $1,066,700. This represents a 4.3 per cent increase from January 2023 and a 0.6 per cent decrease compared to December 2023.

GET THE FULL REPORT HERE

Read

The latest Greater Vancouver Stats Pack from the Vancouver Real Estate Board.

The Latest 2024 Market Stats by area are out and available for download. You get the following data, graphs and charts.

  • Activity Snapshot by Property

  • Type Detached Properties Report and Graph

  • Condo Report and Graph

  • Townhomes Report and Graph

  • Benchmark Price Graph

  • Average Price Per Square Foot

GET THE GREATER VANCOUVER REPORT

If you are interested in a report like this is for other areas, please contact us to request it and I'll send it to you.

Read

Metro Vancouver housing market shows resilience in 2023, ending the year in balanced territory

Metro Vancouver’s housing market closed out 2023 with balanced market conditions, but the year-end totals mask a story of surprising resilience in the face of the highest borrowing costs seen in over a decade.

The Real Estate Board of Greater Vancouver (REBGV) reports that residential sales in the region totalled 26,249 in 2023, a 10.3 per cent decrease from the 29,261 sales recorded in 2022, and a 41.5 per cent decrease from the 44,884 sales in 2021.

Last year’s sales total was 23.4 per cent below the 10-year annual sales average (34,272).

“You could miss it by just looking at the year-end totals, but 2023 was a strong year for the Metro Vancouver housing market considering that mortgage rates were the highest they’ve been in over a decade,” Andrew Lis, REBGV’s director of economics and data analytics said. “In our 2023 forecast, we called for modest price increases throughout the year while most other forecasters were predicting price declines. The fact that we ended the year with five-per-cent-plus gains in home prices across all market segments demonstrates that Metro Vancouver remains an attractive and desirable destination, and elevated borrowing costs alone aren’t enough to dissuade buyers determined to get into this market.”

Properties listed on the Multiple Listing Service® (MLS®) in Metro Vancouver totalled 50,893 in 2023. This represents a 7.5 per cent decrease compared to the 55,047 properties listed in 2022. This was 20.2 per cent below the 63,761 properties listed in 2021.

The total number of properties listed last year was 10.5 per cent below the region’s 10-year total annual average of (56,868).

Currently, the total number of homes listed for sale on the MLS® system in Metro Vancouver is 8,802, a 13 per cent increase compared to December 2022 (7,791). This is 0.3 per cent above the 10-year seasonal average (8,772).

The MLS® Home Price Index composite benchmark price for all residential properties in Metro Vancouver is currently $1,168,700. This represents a five per cent increase over December 2022 and a 1.4 per cent decrease compared to November 2023.

“Ultimately, the story of 2023 is one of too few homes available relative to the pool of willing and qualified buyers,” Lis said. “Sellers were reluctant to list their properties early in the year, which led to fewer sales than usual coming out of the gate. But this also led to near record-low inventory levels in the spring, which put upward pressure on prices as buyers competed for the scarce few homes available.”

“Looking back on the year, it’s hard not to wonder how we’d be closing out 2023 if mortgage rates had been a few per cent lower than they were. And it looks like we might get some insight into that question in 2024, as bond markets and professional forecasters are projecting lower borrowing costs are likely to come, with modest rate cuts expected in the first half of the New Year.”

December 2023 summary

Residential sales in the region totalled 1,345 in December 2023, a 3.2 per cent increase from the 1,303 sales recorded in December 2022. This was 36.4 per cent below the 10-year seasonal average (2,114).

There were 1,327 detached, attached and apartment properties newly listed for sale on the Multiple Listing Service® (MLS®) in Metro Vancouver in December 2023. This represents a 9.9 per cent increase compared to the 1,208 properties listed in December 2022. This was 22.7 per cent below the 10-year seasonal average (1,716).

Across all detached, attached and apartment property types, the sales-to-active listings ratio for December 2023 is 16 per cent. By property type, the ratio is 11.1 per cent for detached homes, 18.7 per cent for attached, and 19.6 per cent for apartments.

Analysis of the historical data suggests downward pressure on home prices occurs when the ratio dips below 12 per cent for a sustained period, while home prices often experience upward pressure when it surpasses 20 per cent over several months.

Sales of detached homes in December 2023 reached 376, a 1.3 per cent increase from the 371 detached sales recorded in December 2022. The benchmark price for a detached home is $1,964,400. This represents a 7.7 per cent increase from December 2022 and a 0.9 per cent decrease compared to November 2023.

Sales of apartment homes reached 719 in December 2023, a 2.4 per cent increase compared to the 702 sales in December 2022. The benchmark price of an apartment home is $751,300. This represents a 5.6 per cent increase from December 2022 and a 1.5 per cent decrease compared to November 2023.

Attached home sales in December 2023 totalled 238, a 7.2 per cent increase compared to the 222 sales in December 2022. The benchmark price of a townhouse3 is $1,072,700. This represents a 6.4 per cent increase from December 2022 and a 1.8 per cent decrease compared to November 2023.

Read

Andrew and Jill's November 2023 Stats Pack East and West from the Vancouver Real Estate Board.

The Latest 2023 Market Stats by area are out and available for download. You get the following graphs and charts for both Vancouver East and Vancouver West.

  • Activity Snapshot by Property

  • Type Detached Properties Report and Graph

  • Condo Report and Graph

  • Townhomes Report and Graph

  • Benchmark Price Graph

  • Average Price Per Square Foot

Contact us for a free Market Ready walkthrough | 604-657-7936

Read

Balanced conditions come to the Metro Vancouver housing market for the holiday season

VANCOUVER, BC – December 4, 2023– With one month left in 2023, a steady increase in housing inventory is offering home buyers across Metro Vancouver among the largest selection to choose from since 2021.

The Real Estate Board of Greater Vancouver (REBGV) reports that residential sales in the region totalled 1,702 in November 2023, a 4.7 per cent increase from the 1,625 sales recorded in November 2022. This was 33 per cent below the 10-year seasonal average (2,538).

“We’ve been watching the number of active listings in our market increase over the past few months, which is giving buyers more to choose from than they’ve been used to seeing over the past few years,” Andrew Lis, REBGV’s director of economics and data analytics said. “When paired with the seasonal slowdown in sales we typically see this time of year, this increase in supply is creating balanced conditions across Metro Vancouver’s housing market.”

There were 3,369 detached, attached and apartment properties newly listed for sale on the Multiple Listing Service® (MLS®) in Metro Vancouver in November 2023. This represents a 9.8 per cent increase compared to the 3,069 properties listed in November 2022. This was 2.8 per cent below the 10-year seasonal average (3,464).

The total number of properties currently listed for sale on the MLS® system in Metro Vancouver is 10,931, a 13.5 per cent increase compared to November 2022 (9,633). This is 3.7 per cent above the 10-year seasonal average (10,543).

Across all detached, attached and apartment property types, the sales-to-active listings ratio for November 2023 is 16.3 per cent. By property type, the ratio is 12.7 per cent for detached homes, 19.8 per cent for attached, and 18.2 per cent for apartments.

Analysis of the historical data suggests downward pressure on home prices occurs when the ratio dips below 12 per cent for a sustained period, while home prices often experience upward pressure when it surpasses 20 per cent over several months.

“Balanced market conditions typically come with flatter price trends, and that’s what we’ve seen in the market since the summer months. These trends follow a period where prices rose over seven per cent earlier in the year,” Lis said. “You probably won’t find Cyber Monday discounts, but prices have edged lower by a few per cent since the summer. And with most economists expecting mortgage rates to fall modestly in 2024, market conditions for buyers are arguably the most favorable we’ve seen in some time in our market.”

The MLS® Home Price Index composite benchmark price for all residential properties in Metro Vancouver is currently $1,185,100. This represents a 4.9 per cent increase over November 2022 and a one per cent decrease compared to October 2023.

Sales of detached homes in November 2023 reached 523, a seven per cent increase from the 489 detached sales recorded in November 2022. The benchmark price for a detached home is $1,982,600. This represents a 6.8 per cent increase from November 2022 and a 0.9 per cent decrease compared to October 2023.

Sales of apartment homes reached 850 in November 2023, a 0.4 per cent increase compared to the 847 sales in November 2022. The benchmark price of an apartment home is $762,700. This represents a 6.2 per cent increase from November 2022 and a one per cent decrease compared to October 2023.

Attached home sales in November 2023 totalled 316, a 12.5 per cent increase compared to the 281 sales in November 2022. The benchmark price of a townhouse is $1,092,600. This represents a 6.9 per cent increase from November 2022 and a 0.7 per cent decrease compared to October 2023.

Get your home market ready.
Start with a FREE 30 minute walkthrough

Read

Andrew and Jill's October 2023 Stats Pack East and West from the Vancouver Real Estate Board.

The Latest 2023 Market Stats by area are out and available for download. You get the following graphs and charts for both Vancouver East and Vancouver West.

  • Activity Snapshot by Property

  • Type Detached Properties Report and Graph

  • Condo Report and Graph

  • Townhomes Report and Graph

  • Benchmark Price Graph

  • Average Price Per Square Foot

GET THE VANCOUVER EAST & WEST REPORT

If you are interested in a report like this is for other areas, please contact us to request it and I'll send it to you.

Read

As inventory increases, price gains relent to begin the fall season

The month-over-month price gains seen earlier this year abated in the Metro Vancouver1 housing market in September due to a seasonal decline in sales and a modest increase in inventory levels across the region.

The Real Estate Board of Greater Vancouver (REBGV) reports that residential home sales in the region totalled 1,926 in September 2023, a 13.2 per cent increase from the 1,701 sales recorded in September 2022. This was 26.3 per cent below the 10-year seasonal average (2,614).

There were 5,446 detached, attached and apartment properties newly listed for sale on the Multiple Listing Service® (MLS®) in Metro Vancouver in September 2023. This represents a 28.4 per cent increase compared to the 4,243 homes listed in September 2022.

This was 5.2 per cent above the 10-year seasonal average (5,179).

The total number of homes currently listed for sale on the MLS® system in Metro Vancouver is 11,382, a 9.2 per cent increase compared to September 2022 (10,427). This was 6.2 per cent below the 10-year seasonal average (12,136).

Across all detached, attached and apartment property types, the sales-to-active listings ratio for September 2023 is 17.7 per cent. By property type, the ratio is 12.6 per cent for detached homes, 21.6 per cent for townhomes, and 21.3 per cent for apartments.

Analysis of the historical data suggests downward pressure on home prices occurs when the ratio dips below 12 per cent for a sustained period, while home prices often experience upward pressure when it surpasses 20 per cent over several months.

“In contrast to the spring and summer, the September data suggests there may be a renewed interest on the part of sellers to participate in the market, with new listing activity rising back in line with long-term historical averages. This upward shift in new listings has allowed overall inventory levels to recover modestly from the low levels we saw earlier this year,” Lis said. “When we pair this dynamic with the slowdown in sales that typically occurs in the fall as a result of seasonal patterns, the outcome is more balanced market conditions overall.”

The MLS® Home Price Index composite benchmark price for all residential properties in Metro Vancouver is currently $1,203,300. This represents a 4.4 per cent increase over September 2022 and a 0.4 per cent decrease compared to August 2023.

Sales of detached homes in September 2023 reached 572, a 7.5 per cent increase from the 532 detached sales recorded in September 2022. The benchmark price for a detached home is $2,017,100. This represents a 5.8 per cent increase from September 2022 and a 0.1 per cent decrease compared to August 2023.

Sales of apartment homes reached 988 in September 2023, an 11.3 per cent increase compared to the 888 sales in September 2022. The benchmark price of an apartment home is $768,500. This represents a 5.8 per cent increase from September 2022 and a 0.2 per cent decrease compared to August 2023.

Attached home sales in September 2023 totalled 352, a 28.5 per cent increase compared to the 274 sales in September 2022. The benchmark price of an attached home is $1,098,400. This represents a 5.3 per cent increase from September 2022 and a 0.5 per cent decrease compared to August 2023.

Read

Andrew and Jill's September 2023 Stats Pack East and West from the Vancouver Real Estate Board.

The Latest 2023 Market Stats by area are out and available for download. You get the following graphs and charts for both Vancouver East and Vancouver West.

  • Activity Snapshot by Property

  • Type Detached Properties Report and Graph

  • Condo Report and Graph

  • Townhomes Report and Graph

  • Benchmark Price Graph

  • Average Price Per Square Foot

GET THE VANCOUVER EAST & WEST REPORT

If you are interested in a report like this is for other areas, please contact us to request it and I'll send it to you.

Read
Reciprocity Logo The data relating to real estate on this website comes in part from the MLS® Reciprocity program of either the Greater Vancouver REALTORS® (GVR), the Fraser Valley Real Estate Board (FVREB) or the Chilliwack and District Real Estate Board (CADREB). Real estate listings held by participating real estate firms are marked with the MLS® logo and detailed information about the listing includes the name of the listing agent. This representation is based in whole or part on data generated by either the GVR, the FVREB or the CADREB which assumes no responsibility for its accuracy. The materials contained on this page may not be reproduced without the express written consent of either the GVR, the FVREB or the CADREB.