RSS

Housing market conditions continue to favour home buyers


The Metro Vancouver housing market saw increased supply from home sellers and below average demand from home buyers in February.


The Real Estate Board of Greater Vancouver (REBGV) reports that residential home sales in the region totalled 1,484 in February 2019, a 32.8 per cent decrease from the 2,207 sales recorded in February 2018, and a 34.5 per cent increase from the 1,103 homes sold in January 2019.


Last month’s sales were 42.5 per cent below the 10-year February sales average.


“For much of the past four years, we’ve been in a sellers’ market. Conditions have shifted over the last 12 months to favour buyers, particularly in the detached home market,” Phil Moore, REBGV president said. “This means that home buyers face less competition today, have more selection to choose from and more time to make their decisions.”


There were 3,892 detached, attached and apartment properties newly listed for sale on the Multiple Listing Service® (MLS®) in Metro Vancouver in February 2019. This represents a 7.8 per cent decrease compared to the 4,223 homes listed in February 2018 and a 19.7 per cent decrease compared to the 4,848 homes listed in January 2019.


The total number of homes currently listed for sale on the MLS® system in Metro Vancouver is 11,590, a 48.2 per cent increase compared to February 2018 (7,822) and a 7.2 per cent increase compared to January 2019 (10,808).


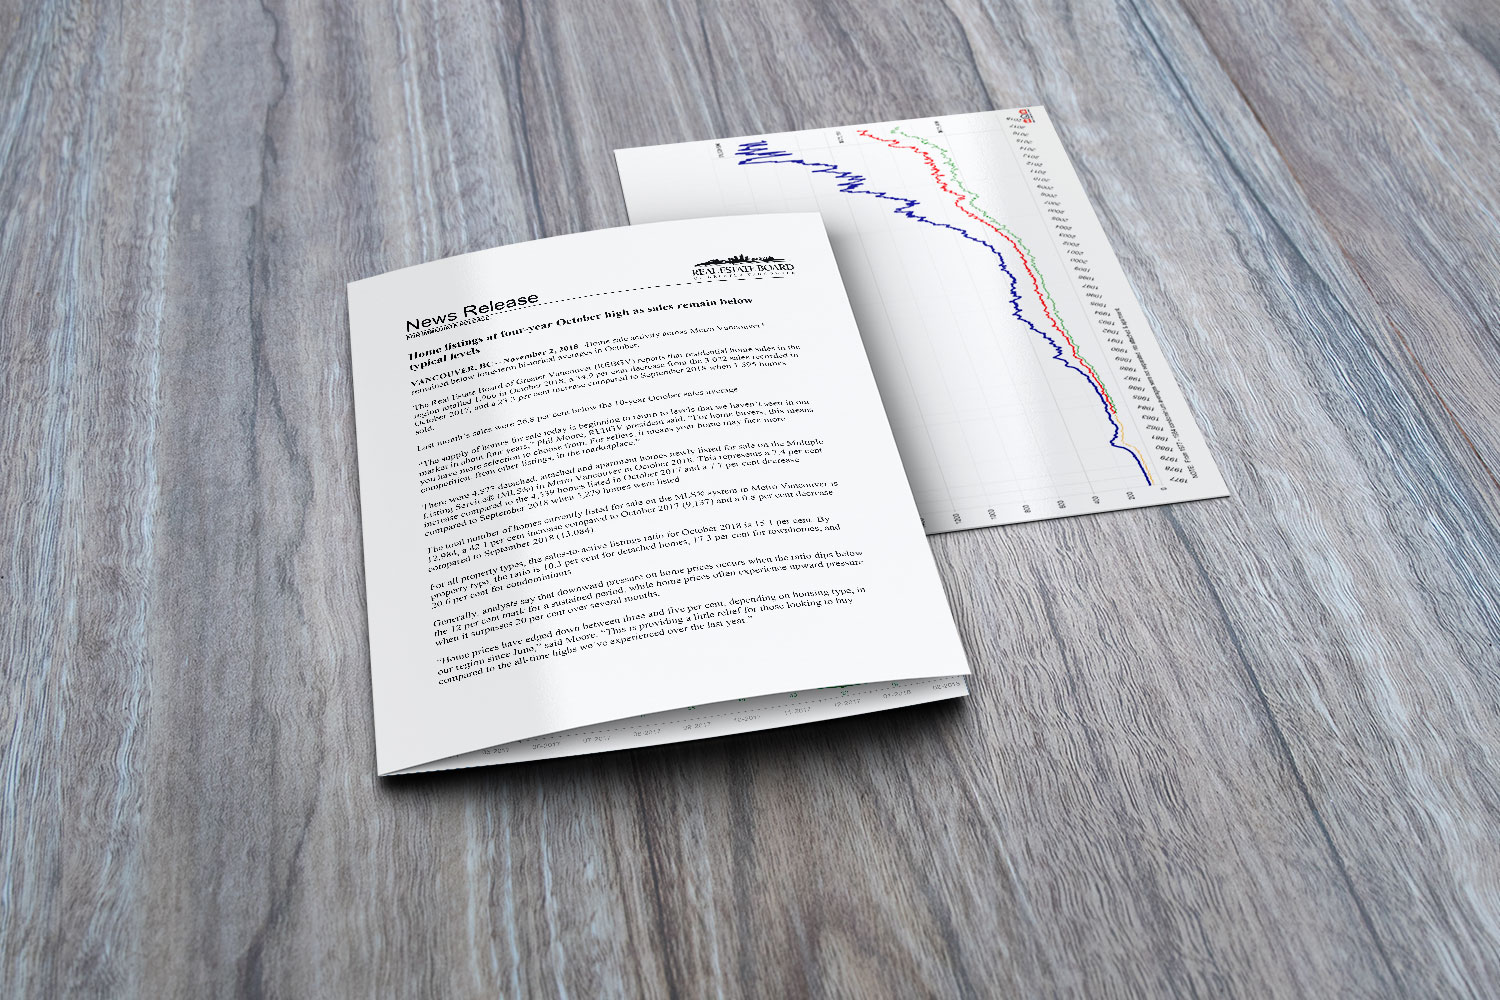
For all property types, the sales-to-active listings ratio for February 2019 is 12.8 per cent.


Generally, analysts say that downward pressure on home prices occurs when the ratio dips below the 12 per cent mark for a sustained period, while home prices often experience upward pressure when it surpasses 20 per cent over several months.


“Homes priced well for today’s market are attracting interest, however, buyers are choosing to take a wait-and-see approach for the time being,” Moore said. “REALTORS® continue to experience more traffic at open houses. We’ll see if this trend leads to increased sales activity during the spring market.”


The MLS® Home Price Index composite benchmark price for all residential properties in Metro Vancouver is currently $1,016,600. This represents a 6.1 per cent decrease over February 2018, a 6.2 per cent decrease over the past six months, and a 0.3 per cent decrease compared to January 2019.


Sales of detached homes in February 2019 reached 448, a 27.9 per decrease cent from the 621 detached sales recorded in February 2018. The benchmark price for detached properties is $1,443,100. This represents a 9.7 per cent decrease from February 2018, a 7.6 per cent decrease over the past six months, and a 0.7 per cent decrease compared to January 2019.


Sales of apartment homes reached 759 in February 2019, a 35.9 per cent decrease compared to the 1,185 sales in February 2018. The benchmark price of an apartment property is $660,300. This represents a four per cent decrease from February 2018, a 5.1 per cent decrease over the past six months, and a 0.3 per cent increase compared to January 2019.


Attached home sales in February 2019 totalled 277, a 30.9 per cent decrease compared to the 401 sales in February 2018. The benchmark price of an attached unit is $789,300. This represents a 3.3 per cent decrease from February 2018, a 6.7 per cent decrease over the past six months, and a 1.4 per cent decrease compared to January 2019.  


GET THE FULL REPORT


Read

Real Estate Board of Greater Vancouver January 2019 Market Stats
The January 2018 Market stats are out and available for download. You get the following graphs and charts for both Vancouver East and Vancouver West.
  • Activity Snapshot by PropertyType
  • Detached Properties Report and Graph
  • Condo Report and Graph
  • Townhomes Report and Graph
  • Benchmark Price Graph
  • Average Price Per Square Foot
If you are interested in a report like this is for other areas, please contact me to request it and I'll send it to you.
 
Read

Home listings increase while buyers remain in holding pattern

VANCOUVER, BC – February 4, 2019 – Home listings continue to increase across all housing categories in the Metro Vancouver* housing market while home buyer activity remains below historical averages.


The Real Estate Board of Greater Vancouver (REBGV) reports that residential home sales in the region totalled 1,103 in January 2019, a 39.3 per cent decrease from the 1,818 sales recorded in January 2018, and a 2.9 per cent increase from the 1,072 homes sold in December 2018.


Last month’s sales were 36.3 per cent below the 10-year January sales average and were the lowest January-sales total since 2009.


“REALTORS® are seeing more traffic at open houses compared to recent months, however, buyers are choosing to remain in a holding pattern for the time being,” Phil Moore, REBGV president said.


There were 4,848 detached, attached and apartment homes newly listed for sale on the Multiple Listing Service® (MLS®) in Metro Vancouver in January 2019. This represents a 27.7 per cent increase compared to the 3,796 homes listed in January 2018 and a 244.6 per cent increase compared to the 1,407 homes listed in December 2018.


The total number of homes currently listed for sale on the MLS® system in Metro Vancouver is 10,808, a 55.6 per cent increase compared to January 2018 (6,947) and a 5.2 per cent increase compared to December 2018 (10,275).


For all property types, the sales-to-active listings ratio for January 2019 is 10.2 per cent. By property type, the ratio is 6.8 per cent for detached homes, 11.9 per cent for townhomes, and 13.6 per cent for condominiums.


Generally, analysts say that downward pressure on home prices occurs when the ratio dips below the 12 per cent mark for a sustained period, while home prices often experience upward pressure when it surpasses 20 per cent over several months.

“Home prices have edged down across all home types in the region over the last seven months,” Moore said.

The MLS® Home Price Index composite benchmark price for all residential homes in Metro Vancouver is currently $1,019,600. This represents a 4.5 per cent decrease over January 2018, and a 7.2 per cent decrease over the past six months.


“Economic fundamentals underpinning our market for home buyers and sellers remain strong. Today’s market conditions are largely the result of the mortgage stress test that the federal government imposed at the beginning of last year,” Moore said. “This measure, coupled with an increase in mortgage rates, took away as much as 25 per cent of purchasing power from many home buyers trying to enter the market.”


Sales of detached homes in January 2019 reached 339, a 30.4 per cent decrease from the 487 detached sales recorded in January 2018. The benchmark price for detached homes is $1,453,400. This represents a 9.1 per cent decrease from January 2018, and an 8.3 per cent decrease over the past six months.


Sales of apartment homes reached 559 in January 2019, a 44.8 per cent decrease compared to the 1,012 sales in January 2018. The benchmark price of an apartment property is $658,600. This represents a 1.7 per cent decrease from January 2018, and a 6.6 per cent decrease over the past six months.


Attached home sales in January 2019 totalled 205, a 35.7 per cent decrease compared to the 319 sales in January 2018. The benchmark price of an attached unit is $800,600. This represents a 0.5 per cent decrease from January 2018, and a 6.2 per cent decrease over the past six months.


DOWNLOAD THE FULL REPORT

Read

Real Estate Board of Greater Vancouver December 2018 Market Stats
 
The December 2018 Market stats are out and available for download. You get the following graphs and charts for both Vancouver East and Vancouver West.
  • Activity Snapshot by PropertyType
  • Detached Properties Report and Graph
  • Condo Report and Graph
  • Townhomes Report and Graph
  • Benchmark Price Graph
  • Average Price Per Square Foot
If you are interested in a report like this is for other areas, please contact me to request it and I'll send it to you.
 
Read

 Metro Vancouver home sales decline below historical averages in 2018
 
VANCOUVER, BC – January 3, 2019 –Metro Vancouver* home sales in 2018 were the lowest
annual total in the region since 2000.
 
The Real Estate Board of Greater Vancouver (REBGV) reports that sales of detached, attached and apartment properties reached 24,619 on the Multiple Listing Service® (MLS®) in 2018, a 31.6 per cent decrease from the 35,993 sales recorded in 2017, and a 38.4 per cent decrease compared to the 39,943 residential sales in 2016.
 
Last year’s sales total was 25 per cent below the region’s 10-year sales average. “This past year has been a transition period for the Metro Vancouver housing market away from the sellers’ market conditions we experienced in previous years,” Phil Moore, REBGV president said. “High home prices, rising interest rates and new mortgage requirements and taxes all
contributed to the market conditions we saw in 2018.”
 
Home listings in Metro Vancouver reached 53,614 in 2018. This is a 1.9 per cent decrease compared to 54,655 homes listed in 2017 and a 6.9 per cent decrease compared to the 57,596 homes listed in 2016.
 
“The supply of homes for sale will be an important indicator to follow in 2019. We’ve had record building activity in recent years and many projects will complete soon. This will provide additional housing options for home buyers across the region,” Moore said. The MLS® HPI composite benchmark price for all residential homes in Metro Vancouver ends the year at $1,032,400. This is a 2.7 per cent decrease compared to December 2017.
 
“As the total supply of homes for sale began to accumulate in the spring, we began to see downward pressure on prices across all home types throughout the latter half of the year,” Moore said.
 
The benchmark price of detached homes in the region declined 7.8 per cent over the last 12 months and 7.3 per cent since June 2018. Apartment homes increased 0.6 per cent over the last 12 months and have declined 6.4 per cent since June 2018. The benchmark price for townhomes in Metro Vancouver have increased 1.3 per cent since December 2017 and have decreased 5.3 per cent over the last six months.
 
REBGV reports that residential home sales in the region totalled 1,072 in December 2018, a 46.8 per cent decrease from the 2,016 sales recorded in December 2017, and a 33.3 per cent decrease from November 2018 when 1,608 homes sold.
 
Last month’s sales were 43.3 per cent below the 10-year December sales average. There were 1,407 detached, attached and apartment homes newly listed for sale on the MLS® in Metro Vancouver in December 2018. This represents a 25.6 per cent decrease compared to the 1,891 homes listed in December 2017 and a 59.3 per cent decrease compared to November 2018 when 3,461 homes were listed.
 
The total number of homes currently listed for sale on the MLS® system in Metro Vancouver is 10,275, a 47.7 per cent increase compared to December 2017 (6,958) and a 16.5 per cent decrease compared to November 2018 (12,307).
 
 
Read

Vancouver East and West Real Estate Stats for October 2018

The October Market stats are out and available for download. You get the following graphs and charts for both Vancouver East and Vancouver West.

  • Activity Snapshot by Property Type
  • Detached Properties Report and Graph
  • Condo Report and Graph
  • Townhomes Report and Graph
  • Benchmark Price Graph
  • Average Price Per Square Foot

If you are interested in a report like this is for other areas, please contact me to request it and I'll send it to you.


DOWNLOAD VANCOUVER EAST

DOWNLOAD VANCOUVER WEST

Read

Home listings at four-year October high as sales remain below typical levels

VANCOUVER, BC – November 2, 2018 –Home sale activity across Metro Vancouver* remained below long-term historical averages in October.

The Real Estate Board of Greater Vancouver (REBGV) reports that residential home sales in the region totalled 1,966 in October 2018, a 34.9 per cent decrease from the 3,022 sales recorded in October 2017, and a 23.3 per cent increase compared to September 2018 when 1,595 homes sold.

Last month’s sales were 26.8 per cent below the 10-year October sales average.

“The supply of homes for sale today is beginning to return to levels that we haven’t seen in our market in about four years,” Phil Moore, REBGV president said. “For home buyers, this means you have more selection to choose from. For sellers, it means your home may face more competition, from other listings, in the marketplace.”

There were 4,873 detached, attached and apartment homes newly listed for sale on the Multiple Listing Service® (MLS®) in Metro Vancouver in October 2018. This represents a 7.4 per cent increase compared to the 4,539 homes listed in October 2017 and a 7.7 per cent decrease compared to September 2018 when 5,279 homes were listed.

The total number of homes currently listed for sale on the MLS® system in Metro Vancouver is 12,984, a 42.1 per cent increase compared to October 2017 (9,137) and a 0.8 per cent decrease compared to September 2018 (13,084).

For all property types, the sales-to-active listings ratio for October 2018 is 15.1 per cent. By property type, the ratio is 10.3 per cent for detached homes, 17.3 per cent for townhomes, and 20.6 per cent for condominiums.

Generally, analysts say that downward pressure on home prices occurs when the ratio dips below the 12 per cent mark for a sustained period, while home prices often experience upward pressure when it surpasses 20 per cent over several months.

“Home prices have edged down between three and five per cent, depending on housing type, in our region since June,” said Moore. “This is providing a little relief for those looking to buy compared to the all-time highs we’ve experienced over the last year.”

The MLS® Home Price Index composite benchmark price for all residential homes in Metro Vancouver is currently $1,062,100. This represents a one per cent increase over October 2017 and a 3.3 per cent decrease over the last three months.

Sales of detached homes in October 2018 reached 637, a 32.2 per cent decrease from the 940 detached sales recorded in October 2017. The benchmark price for detached properties is
$1,524,000. This represents a 5.1 per cent decrease from October 2017 and a 3.9 per cent decrease over the last three months.

Sales of apartments reached 985 in October 2018, a 35.7 per cent decrease compared to the 1,532 sales in October 2017. The benchmark price of an apartment property is $683,500. This represents a 5.8 per cent increase from October 2017 and a 3.1 per cent decrease over the last three months.

Attached homes sales in October 2018 totalled 344, a 37.5 per cent decrease compared to the 550 sales in October 2017. The benchmark price of an attached home is $829,200. This represents a 4.4 per cent increase from October 2017 and a 2.8 per cent decrease over the last three months.


Download the full report here

Read

Vancouver East and West Sales Stats Packs for July

July’s residential housing sales in Metro Vancouver* reached their lowest levels for that month since the year 2000.
The Real Estate Board of Greater Vancouver (REBGV) reports that residential property sales in the region totalled 2,070 in July 2018, a 30.1 per cent decrease from the 2,960 sales recorded in July 2017, and a decrease of 14.6 per cent compared to June 2018 when 2,425 homes sold.


Last month’s sales were 29.3 per cent below the 10-year July sales average.


Download the Eastside stats pack here

Download the Westside stats pack here

Read