VANCOUVER, BC – November 2, 2022 – Home sale activity across the Metro Vancouver housing market continued to trend well below historical averages in October.
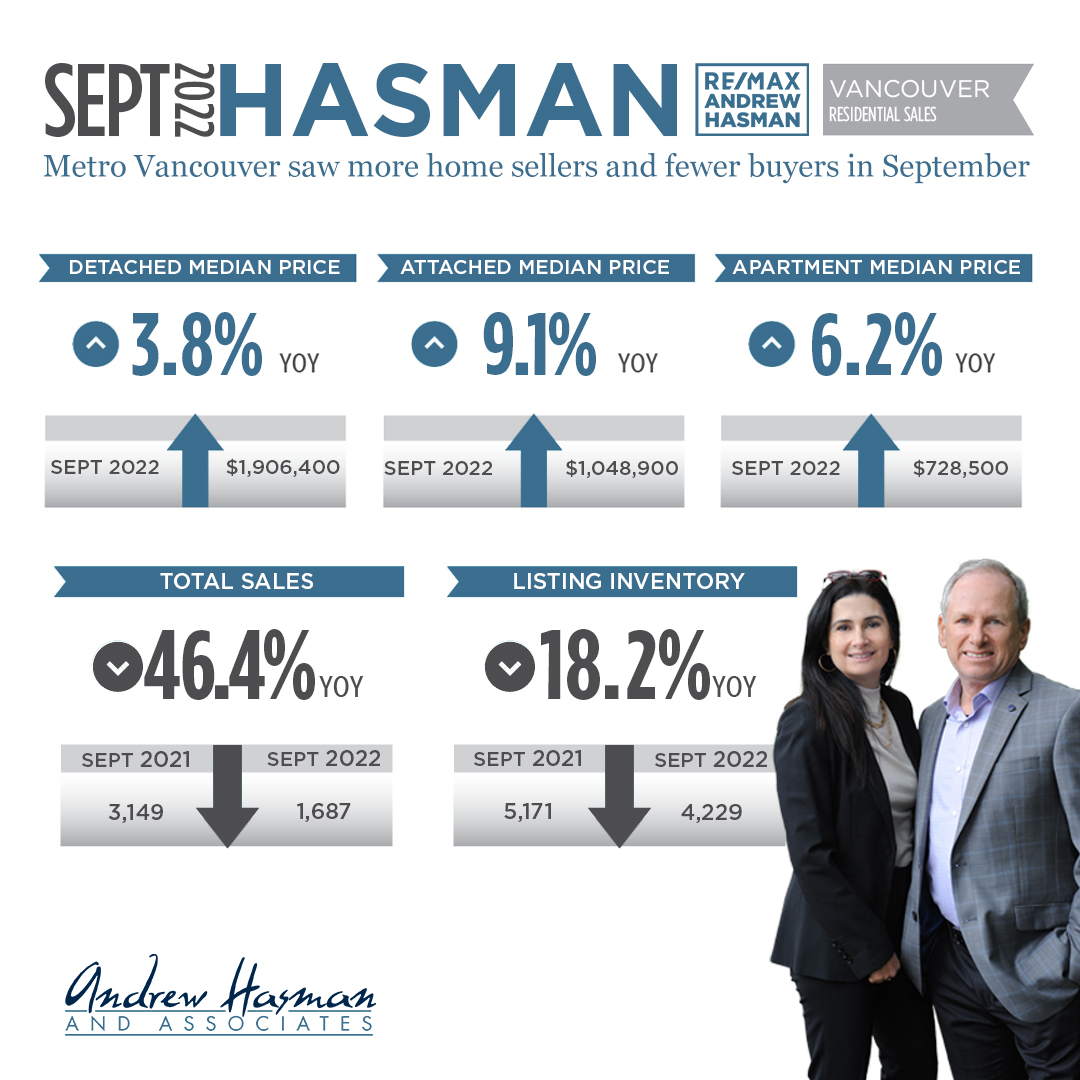
The Real Estate Board of Greater Vancouver (REBGV) reports that residential home sales in the region totalled 1,903 in October 2022, a 45.5 per cent decrease from the 3,494 sales recorded in October 2021, and a 12.8 per cent increase from the 1,687 homes sold in September 2022.
Last month’s sales were 33.3 per cent below the 10-year October sales average.
“Inflation and rising interest rates continue to dominate headlines, leading many buyers and sellers to assess how these factors impact their housing options,” Andrew Lis, REBGV’s director, economics and data analytics said. “With sales remaining near historic lows, the number of active listings continues to inch upward, causing home prices to recede from the record highs set in the spring of 2022.”
There were 4,033 detached, attached and apartment properties newly listed for sale on the Multiple Listing Service® (MLS®) in Metro Vancouver in October 2022. This represents a 0.4 per cent decrease compared to the 4,049 homes listed in October 2021 and a 4.6 per cent decrease compared to September 2022 when 4,229 homes were listed.
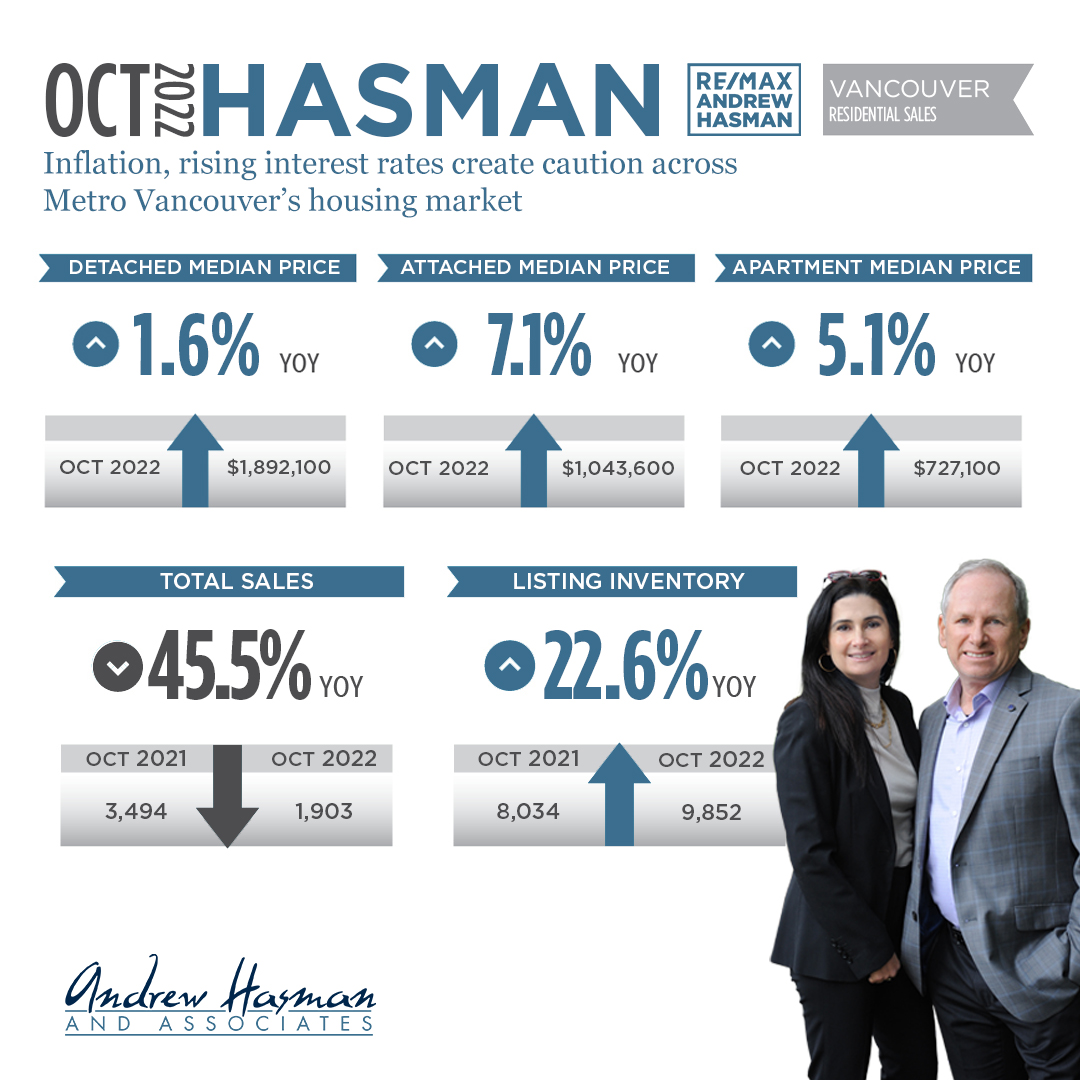
The total number of homes currently listed for sale on the MLS® system in Metro Vancouver is 9,852, a 22.6 per cent increase compared to October 2021 (8,034) and a 1.2 per cent decrease compared to September 2022 (9,971).
“Recent years have been characterized by a frenetic pace of sales amplified by scarce listings on the market to choose from. Today’s market cycle is a marked departure, with a slower pace of sales and more selection to choose from,” Lis said. “This environment provides buyers and sellers more time to conduct home inspections, strata minute reviews, and other due diligence. With the possibly of yet another rate hike by the Bank of Canada this December, it has become even more important to secure financing as early in the process as possible.”
For all property types, the sales-to-active listings ratio for October 2022 is 19.3 per cent. By property type, the ratio is 14.3 per cent for detached homes, 21.6 per cent for townhomes, and 23.2 per cent for apartments.
Generally, analysts say downward pressure on home prices occurs when the ratio dips below 12 per cent for a sustained period, while home prices often experience upward pressure when it surpasses 20 per cent over several months.
The MLS® Home Price Index composite benchmark price for all residential properties in Metro Vancouver is currently $1,148,900. This represents a 2.1 per cent increase from October 2021, a 9.2 per cent decrease over the last six months, and a 0.6 per cent decrease compared to September 2022.
Sales of detached homes in October 2022 reached 575, a 47.2 per cent decrease from the 1,090 detached sales recorded in October 2021. The benchmark price for a detached home is $1,892,100. This represents a 1.6 per cent increase from October 2021 and a 0.7 per cent decrease compared to September 2022.
Sales of apartment homes reached 995 in October 2022, a 44.8 per cent decrease compared to the 1,801 sales in October 2021. The benchmark price of an apartment home is $727,100. This represents a 5.1 per cent increase from October 2021 and a 0.2 per cent decrease compared to September 2022.
Attached home sales in October 2022 totalled 333, a 44.8 per cent decrease compared to the 603 sales in October 2021. The benchmark price of an attached unit is $1,043,600. This represents a 7.1 per cent increase from October 2021 and a 0.5 per cent decrease compared to September 2022.