RSS

Metro Vancouver saw more home sellers and fewer buyers in September

Vancouver, B.C. – October 4, 2022 – Home sellers were more active in Metro Vancouver’s housing market in September while home buyer demand remained below the region’s long-term averages.

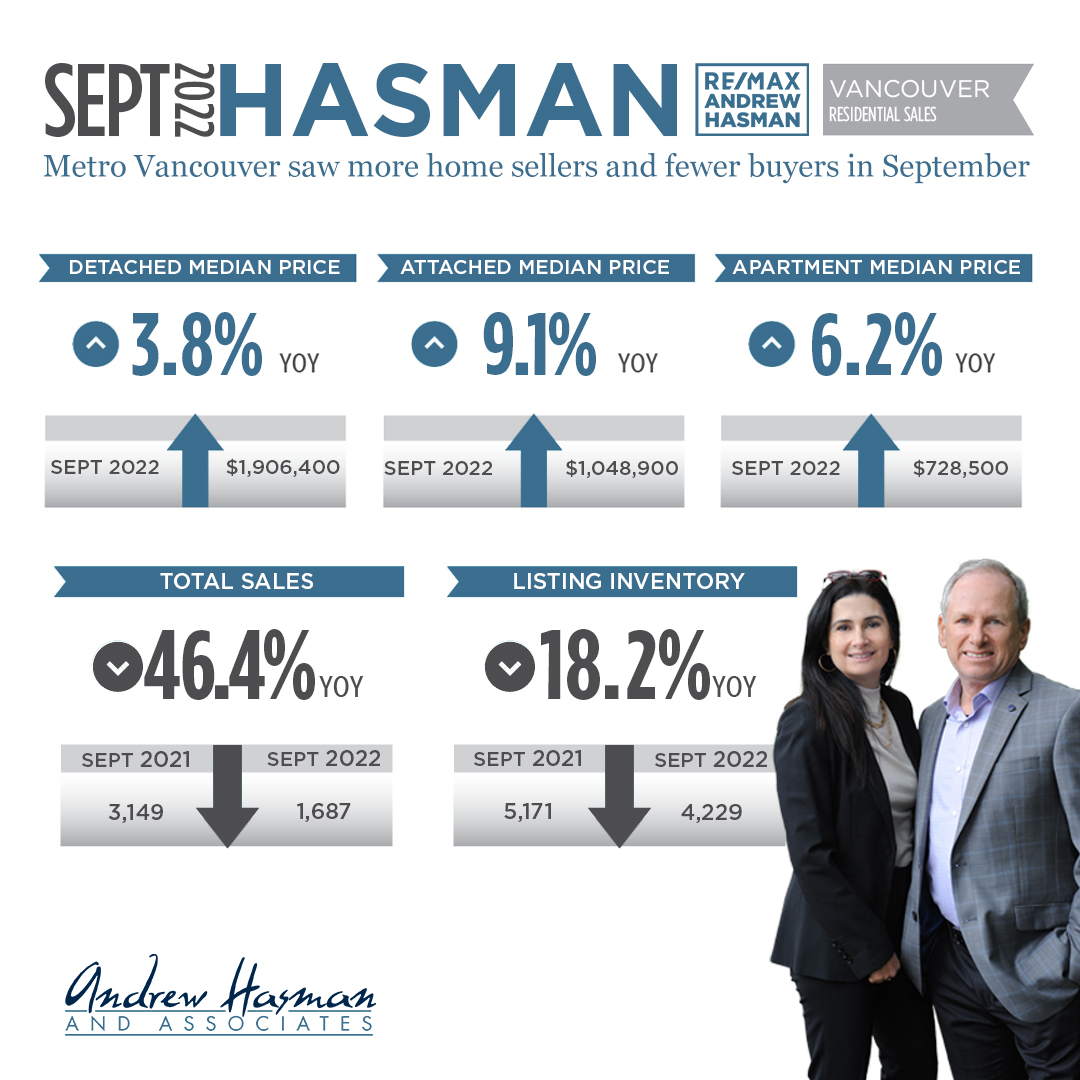
The Real Estate Board of Greater Vancouver (REBGV) reports that residential home sales in the region totalled 1,687 in September 2022, a 46.4 per cent decrease from the 3,149 sales recorded in September 2021, and a 9.8 per cent decrease from the 1,870 homes sold in August 2022.

Last month’s sales were 35.7 per cent below the 10-year September sales average.

“With the Bank of Canada and other central banks around the globe hiking rates in an effort to stamp out inflation, the cost to borrow funds has risen substantially over a short period,” said Andrew Lis, REBGV director, economics and data analytics. “This has resulted in a more challenging environment for borrowers looking to purchase a home, and home sales across the region have dropped accordingly.”


There were 4,229 detached, attached and apartment properties newly listed for sale on the Multiple Listing Service® (MLS®) in Metro Vancouver in September 2022. This represents an 18.2 per cent decrease compared to the 5,171 homes listed in September 2021 and a 27.1 per cent increase compared to August 2022 when 3,328 homes were listed.

The total number of homes currently listed for sale on the MLS® system in Metro Vancouver is 9,971, an eight per cent increase compared to September 2021 (9,236) and a 3.2 per cent increase compared to August 2022 (9,662).

“With fewer homes selling and new listings continuing to come to market, inventory is beginning to accumulate, providing buyers with more selection compared to last year,” Lis said. “With more supply and less demand within this market cycle, residential home prices have edged down in the region over the last six months.”

For all property types, the sales-to-active listings ratio for September 2022 is 16.9 per cent. By property type, the ratio is 12.4 per cent for detached homes, 18.4 per cent for townhomes, and 20.9 per cent for apartments.

Generally, analysts say downward pressure on home prices occurs when the ratio dips below 12 per cent for a sustained period, while home prices often experience upward pressure when it surpasses 20 per cent over several months.

The MLS® Home Price Index composite benchmark price for all residential properties in Metro Vancouver is currently $1,155,300. This represents a 3.9 per cent increase over September 2021, an 8.5 per cent decline over the past six months, and a 2.1 per cent decline compared to August 2022.

Sales of detached homes in September 2022 reached 525, a 44.7 per cent decrease from the 950 detached sales recorded in September 2021. The benchmark price for a detached home is $1,906,400. This represents a 3.8 per cent increase from September 2021 and a 2.4 per cent decrease compared to August 2022.

Sales of apartment homes reached 888 in September 2022, a 45.2 per cent decrease compared to the 1,621 sales in September 2021. The benchmark price of an apartment home is $728,500. This represents a 6.2% per cent increase from September 2021 and a 1.6 per cent decrease compared to August 2022.

Attached home sales in September 2022 totalled 274, a 52.6 per cent decrease compared to the 578 sales in September 2021. The benchmark price of an attached home is $1,048,900. This represents a 9.1 per cent increase from September 2021 and a 1.9 per cent decrease compared to August 2022.


GET THE FULL REPORT

Read

Andrew and Jill's Latest 2022 Stats Pack East and West from the Vancouver Real Estate Board

The Latest 2022 Market Stats by area are out and available for download. You get the following graphs and charts for both Vancouver East and Vancouver West.

  • Activity Snapshot by Property Type
  • Detached Properties Report and Graph
  • Condo Report and Graph
  • Townhomes Report and Graph
  • Benchmark Price Graph
  • Average Price Per Square Foot

If you are interested in a report like this is for other areas, please contact us to request it and I'll send it to you.

GET THE FULL REPORT

Read

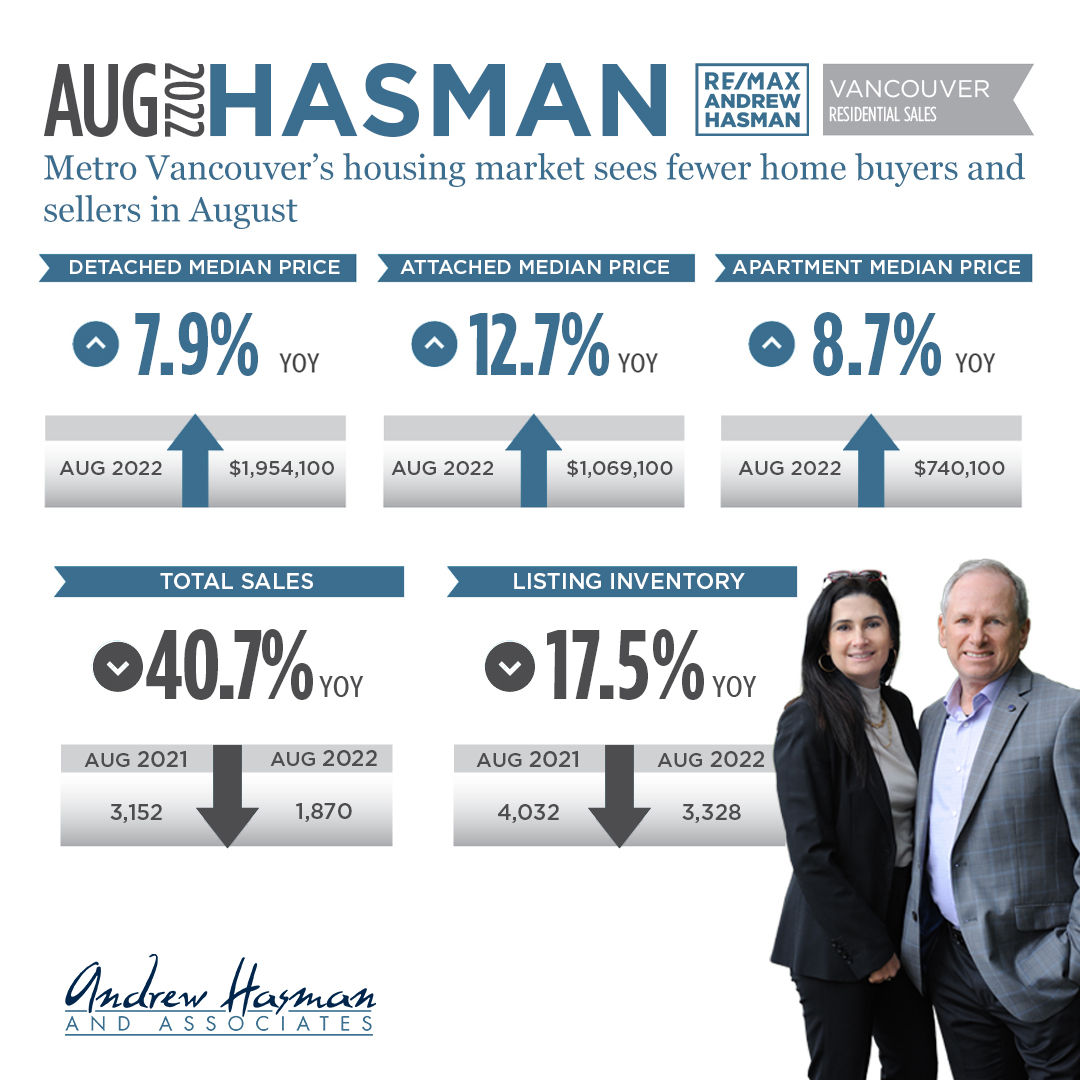
Metro Vancouver’s housing market sees fewer home buyers and sellers in August

Metro Vancouver’s housing market is experiencing a quieter summer season marked by reduced sale and listing activity.

The Real Estate Board of Greater Vancouver (REBGV) reports that residential home sales in the region totalled 1,870 in August 2022, a 40.7 per cent decrease from the 3,152 sales recorded in August 2021, and a 0.9 per cent decrease from the 1,887 homes sold in July 2022.

Last month’s sales were 29.2 per cent below the 10-year August sales average.

“With inflationary pressure and interest rates on the rise, home buyer and seller activity shifted below our long-term seasonal averages this summer,” Andrew Lis, REBGV’s director, economics and data analytics said. “This shift in market conditions caused prices to edge down over the past four months.”

There were 3,328 detached, attached and apartment properties newly listed for sale on the Multiple Listing Service® (MLS®) in Metro Vancouver in August 2022. This represents a 17.5 per cent decrease compared to the 4,032 homes listed in August 2021 and a 16 per cent decrease compared to July 2022 when 3,960 homes were listed.

The total number of homes currently listed for sale on the MLS® system in Metro Vancouver is 9,662, a 7.3 per cent increase compared to August 2021 (9,005) and a 6.1 per cent decrease compared to July 2022 (10,288).

“Home buyers and sellers are taking more time to assess what this changing landscape means for their housing needs,” Lis said. “Preparation is critical in today’s market. Work with your Realtor to assess what today’s home prices, financing options, and other considerations mean for you.”

For all property types, the sales-to-active listings ratio for August 2022 is 19.4 per cent. By property type, the ratio is 12.2 per cent for detached homes, 25.3 per cent for townhomes, and 24.8 per cent for apartments.

Generally, analysts say downward pressure on home prices occurs when the ratio dips below 12 per cent for a sustained period, while home prices often experience upward pressure when it surpasses 20 per cent over several months.

The MLS® Home Price Index composite benchmark price for all residential properties in Metro Vancouver is currently $1,180,500. This represents a 7.4 per cent increase over August 2021 and a 2.2 per cent decrease compared to July 2022.

Sales of detached homes in August 2022 reached 517, a 45.3 per cent decrease from the 945 detached sales recorded in August 2021. The benchmark price for a detached home is $1,954,100. This represents a 7.9 per cent increase from August 2021 and a 2.3 per cent decrease compared to July 2022.

Sales of apartment homes reached 998 in August 2022, a 38.8 per cent decrease compared to the 1,631 sales in August 2021. The benchmark price of an apartment home is $740,100. This represents an 8.7 per cent increase from August 2021 and a two per cent decrease compared to July 2022.

Attached home sales in August 2022 totalled 355, a 38.4 per cent decrease compared to the 576 sales in August 2021. The benchmark price of an attached home is $1,069,100. This represents a 12.7 per cent increase from August 2021 and a 2.5 per cent decrease compared to July 2022.

GET THE FULL REPORT

Read

Summer Update

Hope you are enjoying our beautiful Vancouver summer.

Real Estate wise, a lot has changed in our markets these past few months. Along with that more changes to our industry which will affect Buyers and Sellers going forward and more changes to the Speculation Tax which will also possibly impact those with secondary properties.

Many of our clients' heads are spinning when it comes to real estate and the impacts as a result of inflation, rising interest rates and other policy changes. For anyone looking to buy and or sell there’s a good chance you’ll be impacted one way or the other. What are some of these changes you ask?
  1. Three day rescission period allowing buyers to walk away on a subject free offer within 3 days of offer acceptance. To learn more, here’s a link to our YouTube video “3 day Rescission Period”
  1. The Speculation Tax will be included in more regions. If you own secondary real estate and the property is rented for less than 6 months in a calendar year you may be impacted. The provincial government has widened its reach on where Speculation Tax will be levied. As a property owner make sure you are aware. Go to the Speculation Tax website and see if you’re impacted. To learn more, here’s a link to our YouTube video “Speculation Tax Video”
  2.  Foreign Buyers are restricted from buying residential real estate for 2 years. If you’re thinking of selling and your neighborhood has a significant number of foreign owners then the decision by the federal government to block foreign owners from purchasing may negatively impact prices in your area.
These are just a few points to consider and of course there is the impact of higher interest rates on our real estate market. So many people are asking how this will play out over the next 6-24 months. I’d say in the near term there is definitely a greater risk of prices falling vs staying flat or rising. Presently we are beginning to see markets adjusting into Buyer’s markets. Whether you are buying or selling or maybe you are doing both you’ll be experiencing market conditions much different than what we experienced during the past 2 years.

Questions about real estate? Reach out anytime. Visit and Subscribe to Our YouTube Channel where we have great informative videos that address many current Vancouver Real Estate issues.
Read

ANDREW AND JILL'S REAL ESTATE BOARD LATEST 2022 STATS PACK FOR VANCOUVER

The Latest 2022 Market Stats by area are out and available for download. You get the following graphs and charts for both Vancouver East and Vancouver West.

  • Activity Snapshot by Property Type
  • Detached Properties Report and Graph
  • Condo Report and Graph
  • Townhomes Report and Graph
  • Benchmark Price Graph
  • Average Price Per Square Foot

If you are interested in a report like this is for other areas, please contact us to request it and I'll send it to you.

GET THE FULL REPORT

Read

Home buyer demand continues to ease across Metro Vancouver

Metro Vancouver’s housing market has entered a new cycle marked by quieter home buyer demand and a gradual rise in the supply of homes for sale.

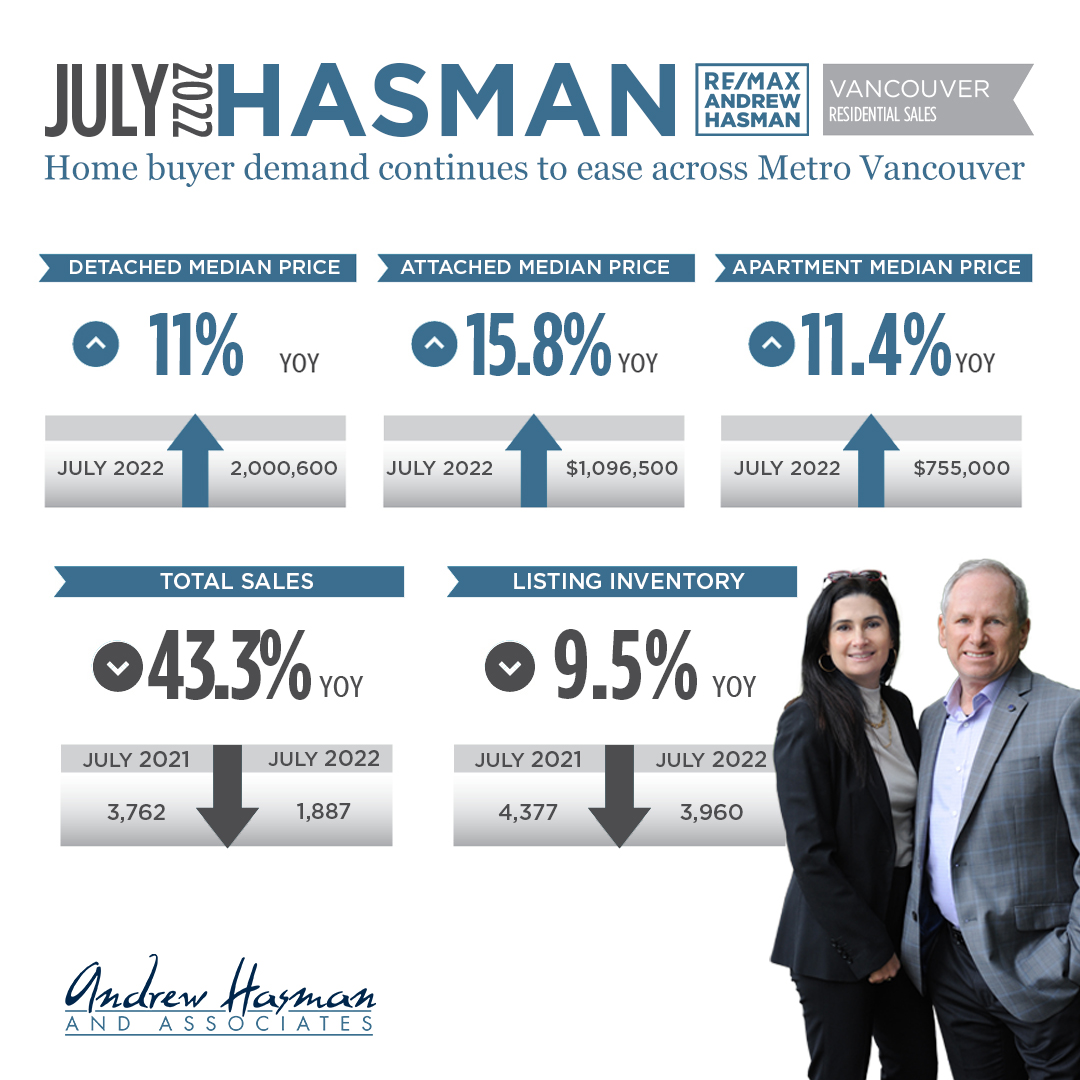
The Real Estate Board of Greater Vancouver (REBGV) reports that residential home sales in the region totalled 1,887 in July 2022, a 43.3 per cent decrease from the 3,326 sales recorded in July 2021, and a 22.8 per cent decrease from the 2,444 homes sold in June 2022.

Last month’s sales were 35.2 per cent below the 10-year July sales average.

“Home buyers are exercising more caution in today’s market in response to rising interest rates and inflationary concerns,” Daniel John, REBGV Chair said. “This allowed the selection of homes for sale to increase and prices to edge down in the region over the last three months.”

There were 3,960 detached, attached and apartment properties newly listed for sale on the Multiple Listing Service® (MLS®) in Metro Vancouver in July 2022. This represents a 9.5 per cent decrease compared to the 4,377 homes listed in July 2021 and a 24.7 per cent decrease compared to June 2022 when 5,256 homes were listed.

The total number of homes currently listed for sale on the MLS® system in Metro Vancouver is 10,288, a 4.4 per cent increase compared to July 2021 (9,850) and a 1.3 per cent decrease compared to June 2022 (10,425).

“After two years of market conditions that favoured home sellers, home buyers now have more selection to choose from and more time to make their decision,” John said. “In today’s changing housing market, both home buyers and sellers should invest the time to understand what these changes mean for their personal circumstances.”

For all property types, the sales-to-active listings ratio for July 2022 is 18.3 per cent. By property type, the ratio is 11.8 per cent for detached homes, 20 per cent for townhomes, and 24.5 per cent for apartments.

Generally, analysts say downward pressure on home prices occurs when the ratio dips below 12 per cent for a sustained period, while home prices often experience upward pressure when it surpasses 20 per cent over several months.

The MLS® Home Price Index composite benchmark price for all residential properties in Metro Vancouver is currently $1,207,400. This represents a 10.3 per cent increase over July 2021 and a 2.3 per cent decrease compared to June 2022.

Sales of detached homes in July 2022 reached 523, a 50.2 per cent decrease from the 1,050 detached sales recorded in July 2021. The benchmark price for a detached home is $2,000,600. This represents an 11 per cent increase from July 2021 and a 2.8 per cent decrease compared to June 2022.

Sales of apartment homes reached 1,060 in July 2022, a 36.4 per cent decrease compared to the 1,666 sales in July 2021. The benchmark price of an apartment home is $755,000. This represents an 11.4 per cent increase from July 2021 and a 1.5 per cent decrease compared to June 2022.

Attached home sales in July 2022 totalled 304, a 50.2 per cent decrease compared to the 610 sales in July 2021. The benchmark price of an attached home is $1,096,500. This represents a 15.8 per cent increase from July 2021 and a 1.7 per cent decrease compared to June 2022.Metro Vancouver’s housing market has entered a new cycle marked by quieter home buyer demand and a gradual rise in the supply of homes for sale.

The Real Estate Board of Greater Vancouver (REBGV) reports that residential home sales in the region totalled 1,887 in July 2022, a 43.3 per cent decrease from the 3,326 sales recorded in July 2021, and a 22.8 per cent decrease from the 2,444 homes sold in June 2022.

Last month’s sales were 35.2 per cent below the 10-year July sales average.

“Home buyers are exercising more caution in today’s market in response to rising interest rates and inflationary concerns,” Daniel John, REBGV Chair said. “This allowed the selection of homes for sale to increase and prices to edge down in the region over the last three months.”

There were 3,960 detached, attached and apartment properties newly listed for sale on the Multiple Listing Service® (MLS®) in Metro Vancouver in July 2022. This represents a 9.5 per cent decrease compared to the 4,377 homes listed in July 2021 and a 24.7 per cent decrease compared to June 2022 when 5,256 homes were listed.

The total number of homes currently listed for sale on the MLS® system in Metro Vancouver is 10,288, a 4.4 per cent increase compared to July 2021 (9,850) and a 1.3 per cent decrease compared to June 2022 (10,425).

“After two years of market conditions that favoured home sellers, home buyers now have more selection to choose from and more time to make their decision,” John said. “In today’s changing housing market, both home buyers and sellers should invest the time to understand what these changes mean for their personal circumstances.”

For all property types, the sales-to-active listings ratio for July 2022 is 18.3 per cent. By property type, the ratio is 11.8 per cent for detached homes, 20 per cent for townhomes, and 24.5 per cent for apartments.

Generally, analysts say downward pressure on home prices occurs when the ratio dips below 12 per cent for a sustained period, while home prices often experience upward pressure when it surpasses 20 per cent over several months.

The MLS® Home Price Index composite benchmark price for all residential properties in Metro Vancouver is currently $1,207,400. This represents a 10.3 per cent increase over July 2021 and a 2.3 per cent decrease compared to June 2022.

Sales of detached homes in July 2022 reached 523, a 50.2 per cent decrease from the 1,050 detached sales recorded in July 2021. The benchmark price for a detached home is $2,000,600. This represents an 11 per cent increase from July 2021 and a 2.8 per cent decrease compared to June 2022.

Sales of apartment homes reached 1,060 in July 2022, a 36.4 per cent decrease compared to the 1,666 sales in July 2021. The benchmark price of an apartment home is $755,000. This represents an 11.4 per cent increase from July 2021 and a 1.5 per cent decrease compared to June 2022.

Attached home sales in July 2022 totalled 304, a 50.2 per cent decrease compared to the 610 sales in July 2021. The benchmark price of an attached home is $1,096,500. This represents a 15.8 per cent increase from July 2021 and a 1.7 per cent decrease compared to June 2022.

GET THE FULL REPORT!

Read

ANDREW AND JILL'S REAL ESTATE BOARD LATEST 2022 STATS PACK FOR VANCOUVER

The Latest 2022 Market Stats by area are out and available for download. You get the following graphs and charts for both Vancouver East and Vancouver West.

  • Activity Snapshot by Property Type
  • Detached Properties Report and Graph
  • Condo Report and Graph
  • Townhomes Report and Graph
  • Benchmark Price Graph
  • Average Price Per Square Foot

If you are interested in a report like this is for other areas, please contact us to request it and I'll send it to you.

GET THE FULL REPORT

Read

Home listings up, sales down and prices starting to decrease to start  the summer season

With interest rates and housing supply increasing, Metro Vancouver home buyers are operating in a changing marketplace to begin the summer season.

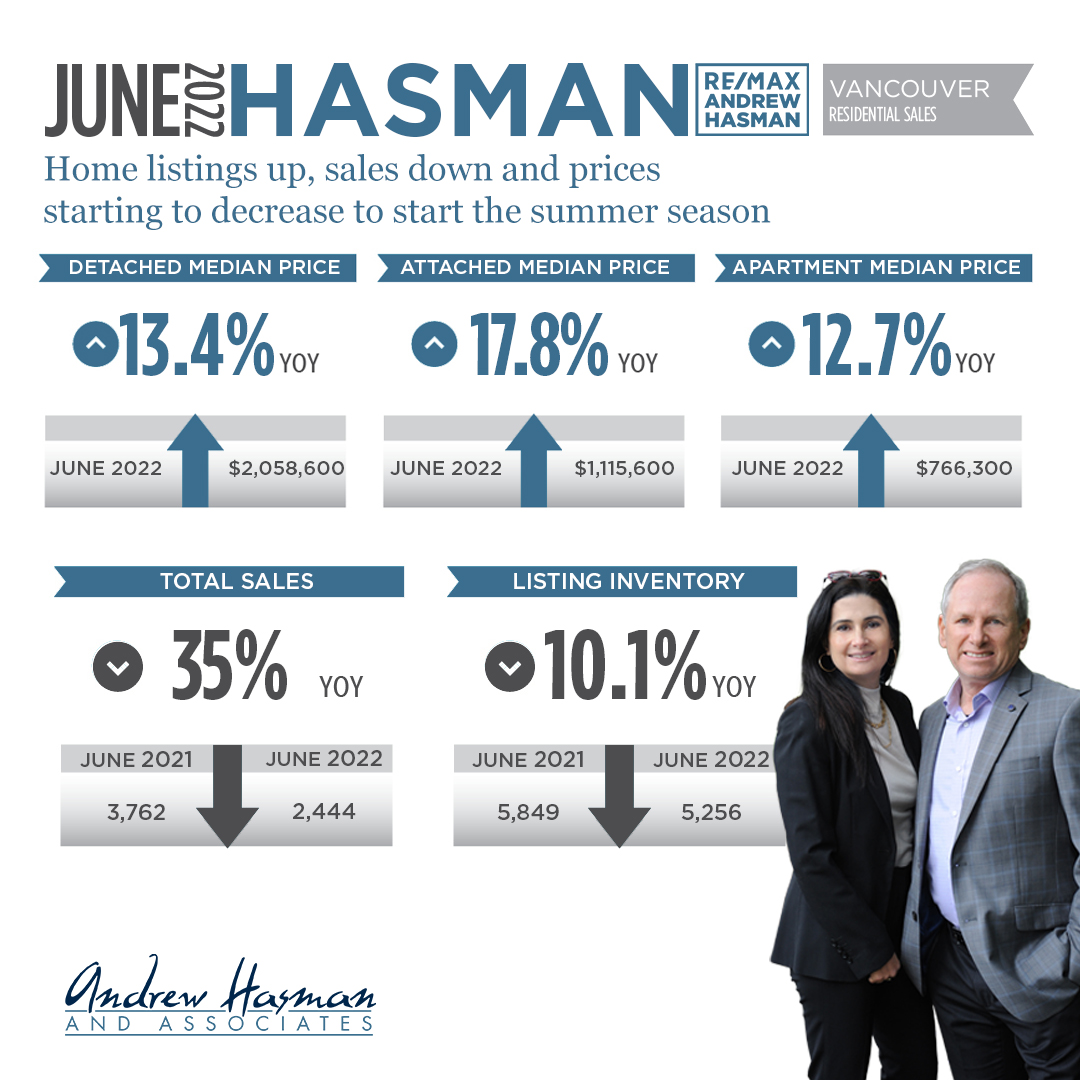
The Real Estate Board of Greater Vancouver (REBGV) reports that residential home sales in the region totalled 2,444 in June 2022, a 35 per cent decrease from the 3,762 sales recorded in June 2021, and a 16.2 per cent decrease from the 2,918 homes sold in May 2022.

Last month’s sales were 23.3 per cent below the 10-year June sales average.

“Home buyers have more selection to choose from and more time to make decisions than they did over the past year,” Daniel John, REBGV Chair said. “Rising interest rates and inflationary concerns are making buyers more cautious in today’s housing market, which is allowing listings to accumulate.”

There were 5,256 detached, attached and apartment properties newly listed for sale on the Multiple Listing Service® (MLS®) in Metro Vancouver in June 2022. This represents a 10.1 per cent decrease compared to the 5,849 homes listed in June 2021 and a 17.6 per cent decrease compared to May 2022 when 6,377 homes were listed.

The total number of homes currently listed for sale on the MLS® system in Metro Vancouver is 10,425, a 3.8 per cent decrease compared to June 2021 (10,839) and a 4.1 per cent increase compared to May 2022 (10,010).

“We’re seeing downward pressure on home prices as we enter summer in Metro Vancouver due to declining home buyer activity, not increased supply,” John said. “To meet Metro Vancouver’s long-term housing demands, we still need to significantly increase housing supply.”

For all property types, the sales-to-active listings ratio for June 2022 is 23.4 per cent. By property type, the ratio is 14.3 per cent for detached homes, 31.5 per cent for townhomes, and 30.2 per cent for apartments.

Generally, analysts say downward pressure on home prices occurs when the ratio dips below 12 per cent for a sustained period, while home prices often experience upward pressure when it surpasses 20 per cent over several months.

The MLS® Home Price Index composite benchmark price for all residential properties in Metro Vancouver is currently $1,235,900. This represents a 12.4 per cent increase over June 2021, a two per cent decrease compared to May 2022, and a 2.2 per cent decrease over the past three months.

Sales of detached homes in June 2022 reached 653, a 48.3 per cent decrease from the 1,262 detached sales recorded in June 2021. The benchmark price for a detached home is $2,058,600. This represents a 13.4 per cent increase from June 2021, a 1.7 per cent decrease compared to May 2022, and a 1.8 per cent decrease over the past three months.

Sales of apartment homes reached 1,326 in June 2022, a 25.3 per cent decrease compared to the 1,774 sales in June 2021. The benchmark price of an apartment home is $766,300. This represents a 12.7 per cent increase from June 2021, a 1.7 per cent decrease compared to May 2022, and a 0.8 per cent decrease over the past three months.

Attached home sales in June 2022 totalled 465, a 36 per cent decrease compared to the 726 sales in June 2021. The benchmark price of an attached home is $1,115,600. This represents a 17.8 per cent increase from June 2021, a 2.2 per cent decrease compared to May 2022, and a 2.7 per cent decrease over the past three months.

GET THE FULL REPORT

Read

ANDREW AND JILL'S REAL ESTATE BOARD LATEST 2022 STATS PACK FOR VANCOUVER

The Latest 2022 Market Stats by area are out and available for download. You get the following graphs and charts for both Vancouver East and Vancouver West.

  • Activity Snapshot by Property Type
  • Detached Properties Report and Graph
  • Condo Report and Graph
  • Townhomes Report and Graph
  • Benchmark Price Graph
  • Average Price Per Square Foot

If you are interested in a report like this is for other areas, please contact us to request it and I'll send it to you.

GET THE FULL REPORT

Read

Spring ushers in calmer housing market trends in Metro Vancouver

After reaching record-setting levels in 2021, home sale activity has returned to more typical seasonal levels in Metro Vancouver* this spring due, in large part, to rising interest rates.

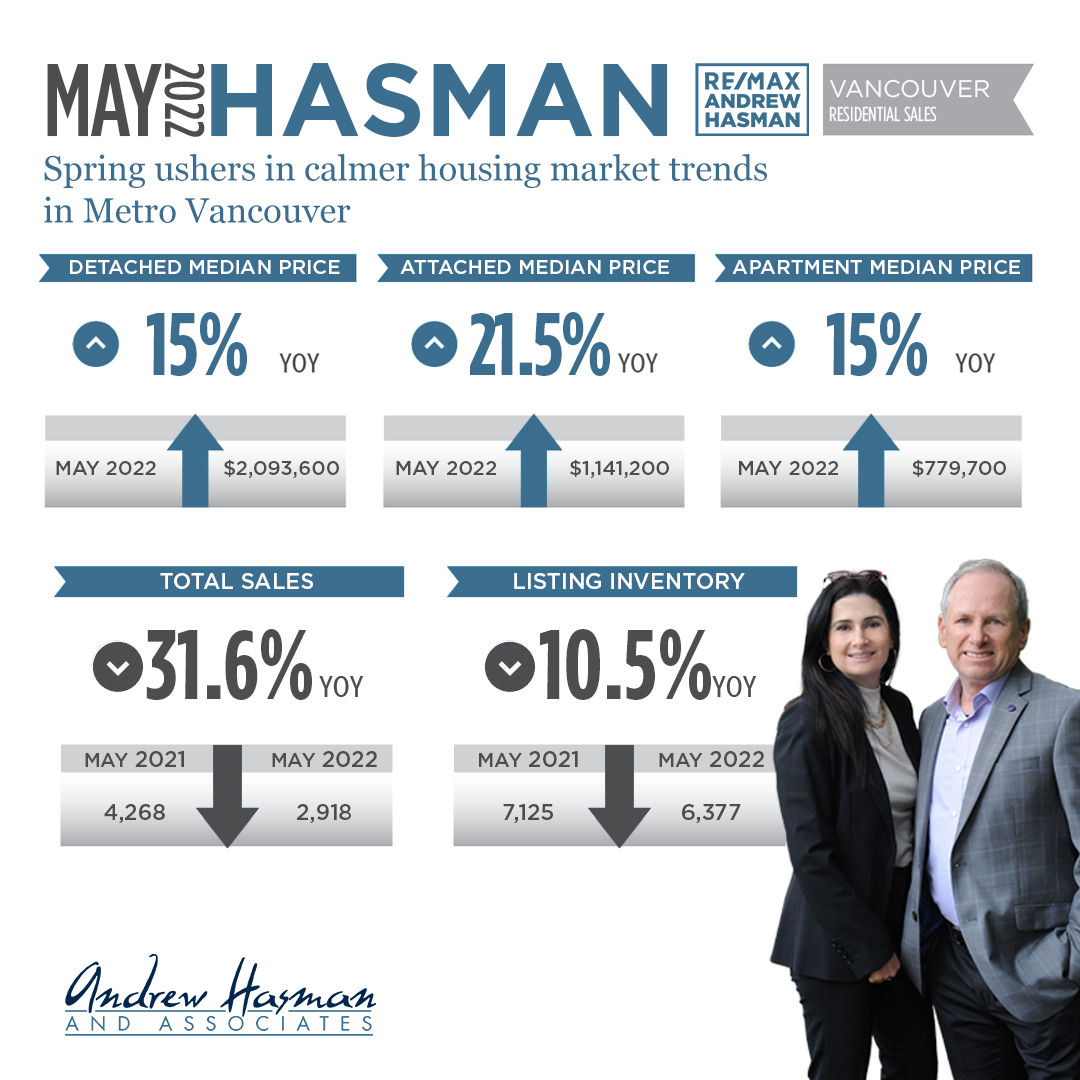
The Real Estate Board of Greater Vancouver (REBGV) reports that residential home sales in the region totalled 2,918 in May 2022, a 31.6 per cent decrease from the 4,268 sales recorded in May 2021, and a 9.7 per cent decrease from the 3,232 homes sold in April 2022.

Last month’s sales were 12.9 per cent below the 10-year May sales average.

“With interest rates rising, home buyers are taking more time to make their decisions in today’s housing market,” said Daniel John, REBGV Chair. “Home buyers have been operating in a frenzied environment for much of the past two years. This spring is providing a calmer environment, with fewer multiple offer situations, which is allowing buyers to explore their housing options, understand the changing mortgage market, and do their due diligence.”

Listings

There were 6,377 detached, attached and apartment properties newly listed for sale on the Multiple Listing Service® (MLS®) in Metro Vancouver in May 2022. This represents a 10.5 per cent decrease compared to the 7,125 homes listed in May 2021 and a 4.4 per cent increase compared to April 2022 when 6,107 homes were listed.

The total number of homes currently listed for sale on the MLS® system in Metro Vancouver is 10,010, an 8.8 per cent decrease compared to May 2021 (10,970) and a 13.8 per cent increase compared to April 2022 (8,796).

Sales-to-active listings ratio

For all property types, the sales-to-active listings ratio for May 2022 is 29.2 per cent. By property type, the ratio is 18.3 per cent for detached homes, 35.5 per cent for townhomes, and 38.1 per cent for apartments.

Generally, analysts say downward pressure on home prices occurs when the ratio dips below 12 per cent for a sustained period, while home prices often experience upward pressure when it surpasses 20 per cent over several months.

Home prices

The MLS® Home Price Index composite benchmark price for all residential properties in Metro Vancouver is currently $1,261,1001. This represents a 14.7 per cent increase over May 2021 and a 0.3 per cent decrease compared to April 2022.

“Upward pressure on home prices has begun to ease in the housing market over the last two months,” John said. “Where home prices go next will depend on housing supply. While we’re beginning to see modest increases in home listings, we still need housing supply totals to more than double to bring the market close to balanced territory.”

Broken down by property type

Sales of detached homes in May 2022 reached 793, a 44.1 per cent decrease from the 1,419 detached sales recorded in May 2021. The benchmark price for a detached home is $2,093,600. This represents a 15 per cent increase from May 2021 and a 0.4 per cent decrease compared to April 2022.

Sales of apartment homes reached 1,605 in May 2022, a 21.7 per cent decrease compared to the 2,049 sales in May 2021. The benchmark price of an apartment home is $779,700. This represents a 15 per cent increase from May 2021 and a 0.4 per cent increase compared to April 2022.

Attached home sales in May 2022 totalled 520, a 35 per cent decrease compared to the 800 sales in May 2021. The benchmark price of an attached home is $1,141,200. This represents a 21.5 per cent increase from May 2021 and a 0.6 per cent decrease compared to April 2022.

MLS® Home Price Index 2022 update

MLS® Home Price Index 2022 update: The national MLS® Home Price Index (MLS® HPI) methodology was updated during an annual review of the model in May. In line with best statistical practices, the MLS® HPI is reviewed each year.

Under the new methodology, benchmark attribute data is derived from data collected from the previous five-year rolling period. Benchmark prices are also now based on current benchmark attributes instead of linking benchmark prices to historical benchmark attributes.

In the annual review, coverage was extended to neighbourhoods where sales volumes picked up enough to support benchmark price tracking and discontinued for neighbourhoods where sales became too sparse to support benchmark price calculations. Read more about these changes.

Due to new housing development, REBGV also expanded the boundaries of the Brentwood neighbourhood in Burnaby, which affected the typical home associated with that area, Central Burnaby, and Parkcrest.

To ensure the MLS® HPI coverage is consistent and comparable, the MLS® HPI historical aggregate and composite data was recalculated based on revised and consistent coverage.


GET THE FULL REPORT

Read
Reciprocity Logo The data relating to real estate on this website comes in part from the MLS® Reciprocity program of either the Greater Vancouver REALTORS® (GVR), the Fraser Valley Real Estate Board (FVREB) or the Chilliwack and District Real Estate Board (CADREB). Real estate listings held by participating real estate firms are marked with the MLS® logo and detailed information about the listing includes the name of the listing agent. This representation is based in whole or part on data generated by either the GVR, the FVREB or the CADREB which assumes no responsibility for its accuracy. The materials contained on this page may not be reproduced without the express written consent of either the GVR, the FVREB or the CADREB.