RSS

ANDREW AND JILL'S REAL ESTATE BOARD LATEST 2021 STATS PACK FOR VANCOUVER

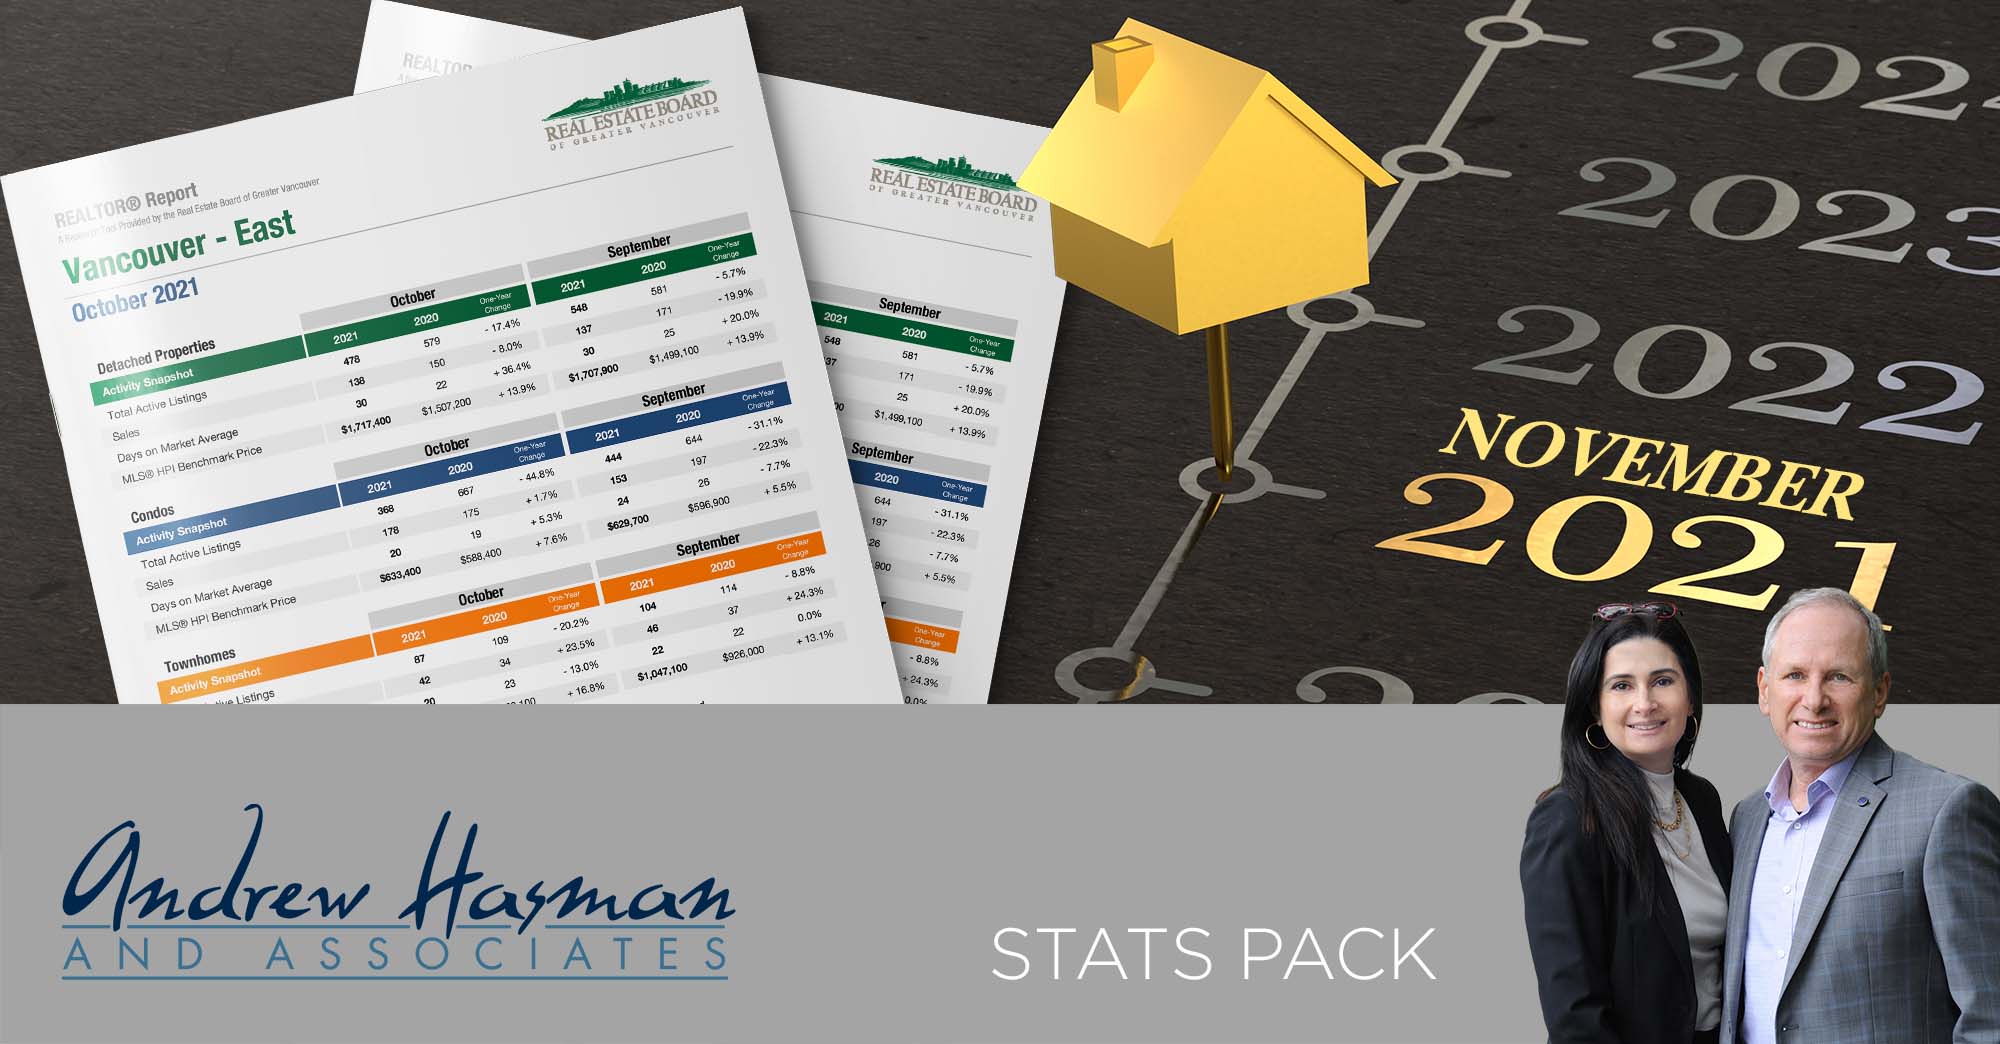
The November 2021 Market stats are out and available for download. You get the following graphs and charts for both Vancouver East and Vancouver West.

  • Activity Snapshot by Property Type
  • Detached Properties Report and Graph
  • Condo Report and Graph
  • Townhomes Report and Graph
  • Benchmark Price Graph
  • Average Price Per Square Foot

If you are interested in a report like this is for other areas, please contact us to request it and I'll send it to you.

DOWNLOAD VANCOUVER EAST & WEST

Read

Home sales activity remains up, listings down across Metro Vancouver’s housing market


As we near the end of 2021, home buyer demand remains well in excess of long-term averages and the supply of homes for sale continues to decline across Metro Vancouver’s* housing market.

The Real Estate Board of Greater Vancouver (REBGV) reports that residential home sales in the region totalled 3,428 in November 2021, an 11.9 per cent increase from the 3,064 sales recorded in November 2020, and a 1.9 per cent decrease from the 3,494 homes sold in October 2021.

Last month’s sales were 33.6 per cent above the 10-year November sales average.

“We expect home sale totals to end the year at or near an all-time record in our region,” Keith Stewart, REBGV economist said. “We’ve had elevated home sale activity throughout 2021 despite persistently low levels of homes available for sale. With a new year around the corner, it’s critical that this supply crunch remains the focus for addressing the housing affordability challenges in our region.”

There were 3,964 detached, attached and apartment properties newly listed for sale on the Multiple Listing Service® (MLS®) in Metro Vancouver in November 2021. This represents a 2.6 per cent decrease compared to the 4,068 homes listed in November 2020 and a 2.1 per cent decrease compared to October 2021 when 4,049 homes were listed.

The total number of homes currently listed for sale on the MLS® system in Metro Vancouver is 7,144, a 35.7 per cent decrease compared to November 2020 (11,118) and a 11.1 per cent decrease compared to October 2021 (8,034).

For all property types, the sales-to-active listings ratio for November 2021 is 48 per cent. By property type, the ratio is 33.8 per cent for detached homes, 74.3 per cent for townhomes, and 53.7 per cent for apartments.

Generally, analysts say downward pressure on home prices occurs when the ratio dips below 12 per cent for a sustained period, while home prices often experience upward pressure when it surpasses 20 per cent over several months.

“The imbalance between supply and demand, coupled with some buyers wanting to use rate holds on lower rate fixed-term mortgages, is keeping upward pressure on home prices in this traditionally quieter time of year for the market,” Stewart said.

The MLS® Home Price Index composite benchmark price for all residential properties in Metro Vancouver is currently $1,211,200. This represents a 16 per cent increase over November 2020 and a one per cent increase compared to October 2021.

Sales of detached homes in November 2021 reached 987, a seven per cent decrease from the 1,061 detached sales recorded in November 2020. The benchmark price for a detached home is $1,870,000. This represents a 20.8 per cent increase from November 2020 and a 1.1 per cent increase compared to October 2021.

Sales of apartment homes reached 1,828 in November 2021, a 33.3 per cent increase compared to the 1,371 sales in November 2020. The benchmark price of an apartment home is $752,800. This represents an 11.4 per cent increase from November 2020 and a 0.9 per cent increase compared to October 2021.

Attached home sales in November 2021 totalled 613, a three per cent decrease compared to the 632 sales in November 2020. The benchmark price of an attached home is $990,300. This represents a 20.2 per cent increase from November 2020 and a 1.6 per cent increase compared to October 2021.


GET THE FULL REPORT


Read

ANDREW AND JILL'S REAL ESTATE BOARD LATEST 2021 STATS PACK FOR VANCOUVER

The October 2021 Market stats are out and available for download. You get the following graphs and charts for both Vancouver East and Vancouver West.

  • Activity Snapshot by Property Type
  • Detached Properties Report and Graph
  • Condo Report and Graph
  • Townhomes Report and Graph
  • Benchmark Price Graph
  • Average Price Per Square Foot

If you are interested in a report like this is for other areas, please contact usto request it and I'll send it to you.

DOWNLOAD VANCOUVER EAST & WEST

Read

Metro Vancouver home buyers compete for fewer home listings in October

Home sale activity in Metro Vancouver remained above historical averages in October while the overall supply of homes for sale dipped to levels not seen in three years.

The Real Estate Board of Greater Vancouver (REBGV) reports that residential home sales in the region totalled 3,494 in October 2021, a 5.2 per cent decrease from the 3,687 sales recorded in October 2020, and an 11 per cent increase from the 3,149 homes sold in September 2021.

Last month’s sales were 22.4 per cent above the 10-year October sales average.

“Home sale activity continues to outpace what’s typical for this time of year and the pool of homes available for sale is in decline. This dynamic between supply and demand is causing home prices to continue to edge up across the region,” Keith Stewart, REBGV economist said.

There were 4,049 detached, attached and apartment properties newly listed for sale on the Multiple Listing Service® (MLS®) in Metro Vancouver in October 2021. This represents a 27.3 per cent decrease compared to the 5,571 homes listed in October 2020 and a 21.7 per cent decrease compared to September 2021 when 5,171 homes were listed.

The total number of homes currently listed for sale on the MLS® system in Metro Vancouver is 8,034, a 35.3 per cent decrease compared to October 2020 (12,416) and a 13 per cent decrease compared to September 2021 (9,236).

“Rising fixed mortgage rates should eventually help ease demand, but for now sales remain strong and buyers with rate holds will remain motivated to find a property for the rest of the year,” Stewart said.

For all property types, the sales-to-active listings ratio for October 2021 is 43.5 per cent. By property type, the ratio is 33.6 per cent for detached homes, 64.4 per cent for townhomes, and 46.7 per cent for apartments.

Generally, analysts say downward pressure on home prices occurs when the ratio dips below 12 per cent for a sustained period, while home prices often experience upward pressure when it surpasses 20 per cent over several months.

The MLS® Home Price Index composite benchmark price for all residential homes in Metro Vancouver is $1,199,400. This represents a 14.7 per cent increase over October 2020 and a 1.1 per cent increase compared to September 2021.

Sales of detached homes in October 2021 reached 1,090, an 18.4 per cent decrease from the 1,335 detached sales recorded in October 2020. The benchmark price for a detached home is $1,850,500. This represents a 20.5 per cent increase from October 2020 and a 1.2 per cent increase compared to September 2021.

Sales of apartment homes reached 1,801 in October 2021, a 14.7 per cent increase compared to the 1,570 sales in October 2020. The benchmark price of an apartment home is $746,400. This represents a 9.5 per cent increase from October 2020 and a 1.1 per cent increase compared to September 2021.

Attached home sales in October 2021 totalled 603, a 22.9 per cent decrease compared to the 782 sales in October 2020. The benchmark price of an attached home is $975,000. This represents an 18.5 per cent increase from October 2020 and a 1.2 per cent increase compared to September 2021.


GET THE FULL REPORT

Read

ANDREW AND JILL'S REAL ESTATE BOARD LATEST 2021 STATS PACK FOR VANCOUVER

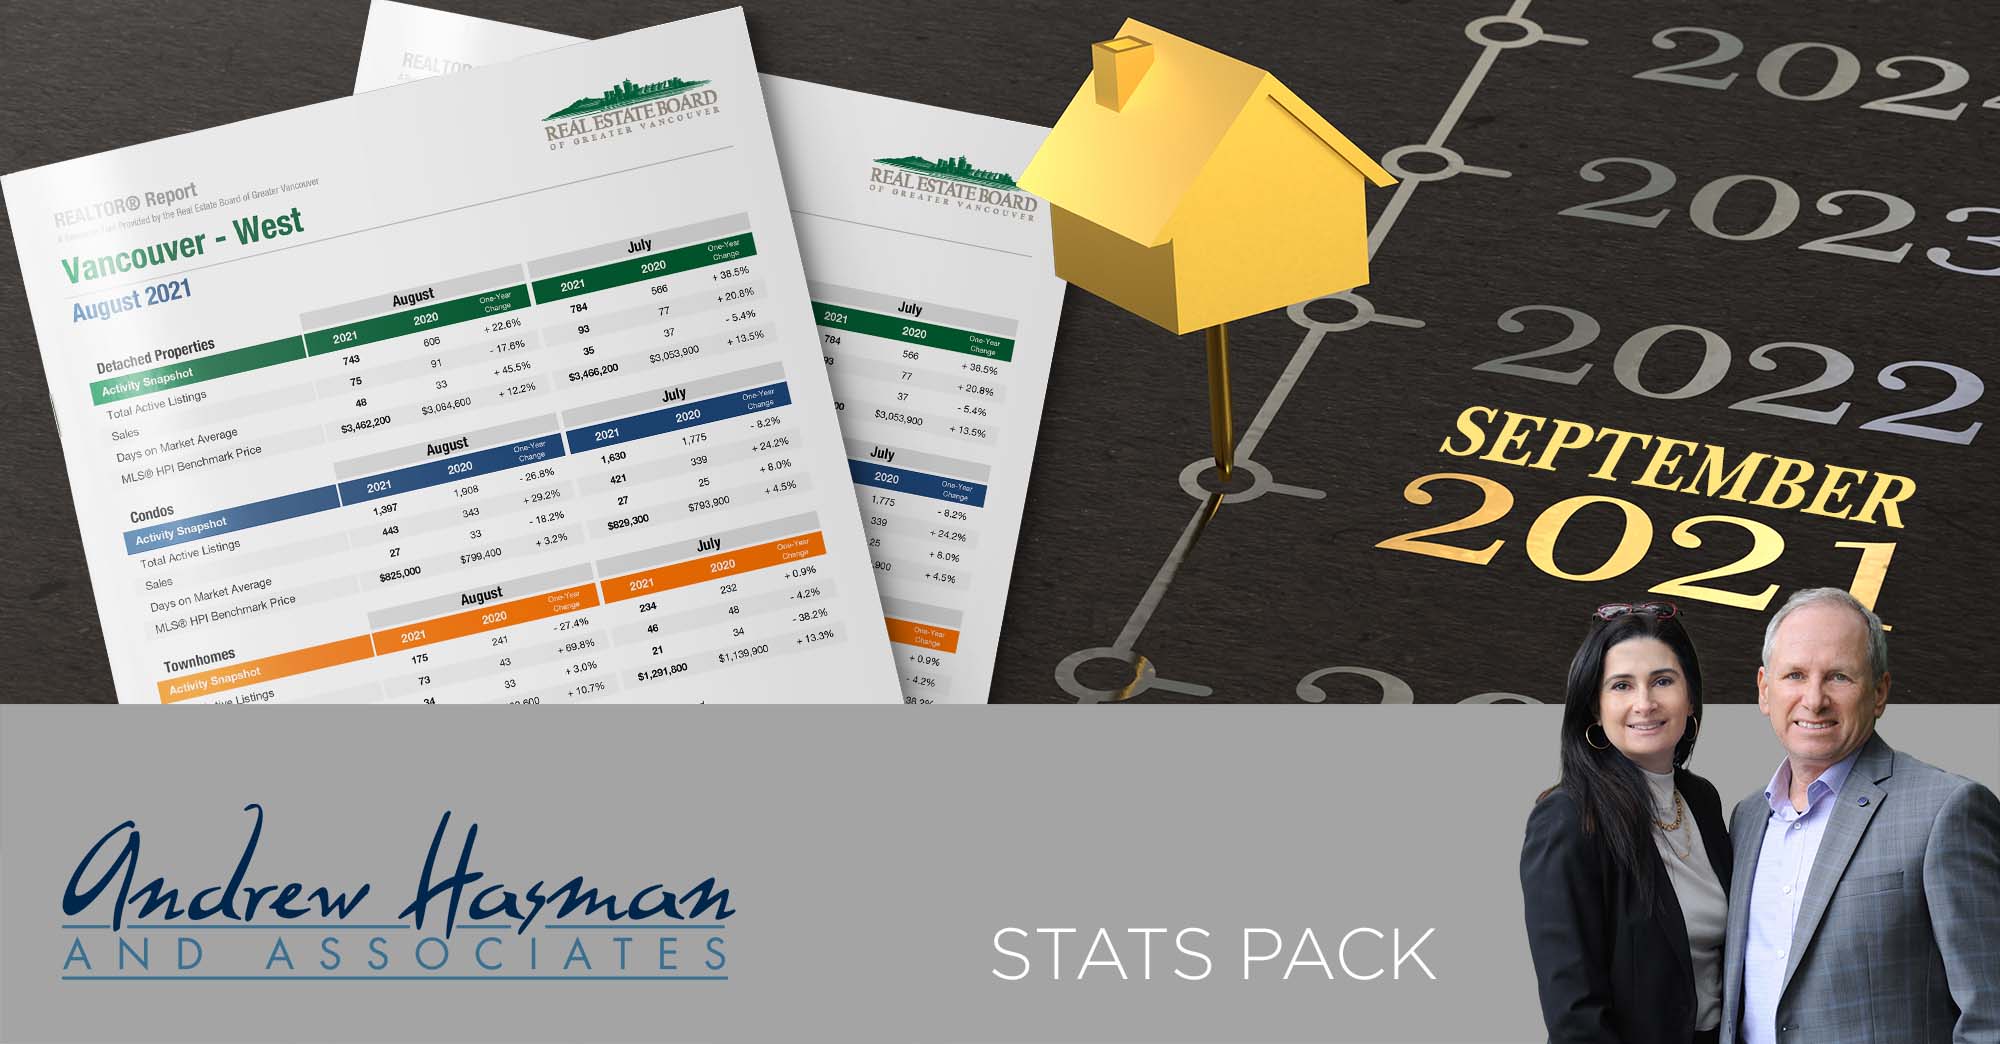
The September 2021 Market stats are out and available for download. You get the following graphs and charts for both Vancouver East and Vancouver West.

  • Activity Snapshot by Property Type
  • Detached Properties Report and Graph
  • Condo Report and Graph
  • Townhomes Report and Graph
  • Benchmark Price Graph
  • Average Price Per Square Foot

If you are interested in a report like this is for other areas, please contact me to request it and I'll send it to you.

DOWNLOAD VANCOUVER EAST & WEST

Read

Elevated home sale activity continues to outstrip the supply of homes for sale in Metro Vancouver

Home sale activity remains elevated across Metro Vancouver’s housing market while the pace of homes being listed for sale continues to follow long-term averages.

The Real Estate Board of Greater Vancouver (REBGV) reports that residential home sales in the region totalled 3,149 in September 2021, a 13.6 per cent decrease from the 3,643 sales recorded in September 2020, and a 0.1 per cent decrease from the 3,152 homes sold in August 2021.

Last month’s sales were 20.8 per cent above the 10-year September sales average.

There were 5,171 detached, attached and apartment properties newly listed for sale on the Multiple Listing Service® (MLS®) in Metro Vancouver in September 2021. This represents a 19.2 per cent decrease compared to the 6,402 homes listed in September 2020 and a 28.2 per cent increase compared to August 2021 when 4,032 homes were listed.

September’s new listings were 1.2 per cent below the 10-year average for the month.

“The summer trend of above-average home sales and historically typical new listings activity continued in Metro Vancouver last month. Although this is keeping the overall supply of homes for sale low, we’re not seeing the same upward intensity on home prices today as we did in the spring,” Keith Stewart, REBGV economist said. “Home price trends will, however, vary depending on property type and neighborhood, so it’s important to take a hyperlocal look at your location and property category of choice before making a home buying or selling decision.”

The total number of homes currently listed for sale on the MLS® system in Metro Vancouver is 9,236. This is a 29.5 per cent decrease compared to September 2020 (13,096), a 2.6 per cent increase compared to August 2021 (9,005) and is 27.7 per cent below the 10-year average for the month.

For all property types, the sales-to-active listings ratio for September 2021 is 34.1 per cent. By property type, the ratio is 25.5 per cent for detached homes, 53.1 per cent for townhomes, and 36.7 per cent for apartments.

Generally, analysts say downward pressure on home prices occurs when the ratio dips below 12 per cent for a sustained period, while home prices often experience upward pressure when it surpasses 20 per cent over several months.

“The total inventory of homes for sale remains insufficient to meet the demand in today’s market. This scarcity limits peoples’ purchasing options and ultimately adds upward pressure on home prices,” Stewart said. “With the federal election now behind us, we hope to see governments at all levels work with the construction industry to streamline the creation of a more abundant and diverse supply of housing options.”

The MLS® Home Price Index composite benchmark price for all residential properties in Metro Vancouver is currently $ 1,186,100. This represents a 13.8 per cent increase over September 2020 and a 0.8 per cent increase compared to August 2021.

Sales of detached homes in September 2021 reached 950, a 27.9 per cent decrease from the 1,317 detached sales recorded in September 2020. The benchmark price for a detached home is $1,828,200. This represents a 20.4 per cent increase from September 2020 and a 1.2 per cent increase compared to August 2021.

Sales of apartment homes reached 1,621 in September 2021, a 1.6 per cent increase compared to the 1,596 sales in September 2020. The benchmark price of an apartment home is $738,600. This represents an 8.4 per cent increase from September 2020 and a 0.5 per cent increase compared to August 2021.

Attached home sales in September 2021 totalled 578, a 20.8 per cent decrease compared to the 730 sales in September 2020. The benchmark price of an attached home is $963,800. This represents a 17.5 per cent increase from September 2020 and a 1.2 per cent increase compared to August 2021.


GET THE FULL REPORT

Read


Vancouver's real estate market was strong during the summer.


With COVID-19 restrictions slowly being lifted, people are being able to travel and do other things rather than buy and sell real estate.


With September 2021 in effect, we are starting off the season seeing a low supply, which is keeping prices fairly firm.


Interest rates remain rock-bottom and as we are nearing an election, it may sometimes drive people to think there is some uncertainty which may cause them to hold off on buying. There is also discussion among election parties about foreign buyers being restricted from buying real estate.


We do, however, have record-low interest rates, and going forward, the market is looking fairly stable, and we could see buyer demand pick up in the fall, which will cause potential prices to continue to trend higher.

Read

ANDREW AND JILL'S REAL ESTATE BOARD LATEST 2021 STATS PACK FOR VANCOUVER

The August 2021 Market stats are out and available for download. You get the following graphs and charts for both Vancouver East and Vancouver West.

  • Activity Snapshot by Property Type
  • Detached Properties Report and Graph
  • Condo Report and Graph
  • Townhomes Report and Graph
  • Benchmark Price Graph
  • Average Price Per Square Foot

If you are interested in a report like this is for other areas, please contact me to request it and I'll send it to you.

DOWNLOAD VANCOUVER EAST & WEST

Read

Summer sees home listing supply decline across Metro Vancouver

While home buyers have remained active in Metro Vancouver throughout the summer, the supply of homes for sale has declined steadily since June.

The Real Estate Board of Greater Vancouver (REBGV) reports that residential home sales in the region totalled 3,152 in August 2021, a 3.4 per cent increase from the 3,047 sales recorded in August 2020, and a 5.2 per cent decrease from the 3,326 homes sold in July 2021.

Last month’s sales were 20.4 per cent above the 10-year August sales average.

“August was busier than expected, and listings activity isn’t keeping up with the pace of demand. This is leaving the market under supplied.” said Keith Stewart, REBGV economist.

There were 4,032 detached, attached and apartment properties newly listed for sale on the Multiple Listing Service® (MLS®) in Metro Vancouver in August 2021. This represents a 30.6 per cent decrease compared to the 5,813 homes listed in August 2020 and a 7.9 per cent decrease compared to July 2021 when 4,377 homes were listed.

The total number of homes currently listed for sale on the MLS® system in Metro Vancouver is 9,005, a 29.7 per cent decrease compared to August 2020 (12,803) and an 8.6 per cent decrease compared to July 2021 (9,850).

“Housing supply is the biggest factor impacting the market right now. To help relieve pressure on prices and improve peoples’ home buying options, the market needs a more abundant supply of homes for sale.” Stewart said. “Housing affordability has been a key issue in the federal election. We encourage the political parties to focus on policy solutions that will help streamline the creation of more diverse housing options for hopeful home buyers today and into the future.”

For all property types, the sales-to-active listings ratio for August 2021 is 35 per cent. By property type, the ratio is 25.3 per cent for detached homes, 51.8 per cent for townhomes, and 39.2 per cent for apartments.

Generally, analysts say downward pressure on home prices occurs when the ratio dips below 12 per cent for a sustained period, while home prices often experience upward pressure when it surpasses 20 per cent over several months.

“When assessing the market, it’s important to understand that while year-over-year price increases have reached double digits, most of the increases happened three or more months ago,” Stewart said. “To better understand the latest home price trends in your preferred location and home type, talk with your local REALTOR®.”

The MLS® Home Price Index composite benchmark price for all residential properties in Metro Vancouver is currently $1,176,600. This represents a 13.2 per cent increase over August 2020 and a 0.1 per cent increase compared to July 2021.

Sales of detached homes in August 2021 reached 945, a 13.7 per cent decrease from the 1,095 detached sales recorded in August 2020. The benchmark price for a detached home is $1,807,100. This represents a 20.4 per cent increase from August 2020 and a 0.3 per cent increase compared to July 2021.

Sales of apartment homes reached 1,631 in August 2021, a 22.4 per cent increase compared to the 1,332 sales in August 2020. The benchmark price of an apartment property is $735,100. This represents a 7.6 per cent increase from August 2020 and a 0.2 per cent decrease compared to July 2021.

Attached home sales in August 2021 totalled 576, a 7.1 per cent decrease compared to the 620 sales in August 2020. The benchmark price of an attached home is $952,600. This represents a 16.5 per cent increase from August 2020 and a 0.3 per cent increase compared to July 2021.


GET THE FULL REPORT

Read

ANDREW AND JILL'S REAL ESTATE BOARD LATEST 2021 STATS PACK FOR VANCOUVER

The July 2021 Market stats are out and available for download. You get the following graphs and charts for both Vancouver East and Vancouver West.

  • Activity Snapshot by Property Type
  • Detached Properties Report and Graph
  • Condo Report and Graph
  • Townhomes Report and Graph
  • Benchmark Price Graph
  • Average Price Per Square Foot

If you are interested in a report like this is for other areas, please contact me to request it and I'll send it to you.

DOWNLOAD VANCOUVER EAST & WEST

Read
Reciprocity Logo The data relating to real estate on this website comes in part from the MLS® Reciprocity program of either the Greater Vancouver REALTORS® (GVR), the Fraser Valley Real Estate Board (FVREB) or the Chilliwack and District Real Estate Board (CADREB). Real estate listings held by participating real estate firms are marked with the MLS® logo and detailed information about the listing includes the name of the listing agent. This representation is based in whole or part on data generated by either the GVR, the FVREB or the CADREB which assumes no responsibility for its accuracy. The materials contained on this page may not be reproduced without the express written consent of either the GVR, the FVREB or the CADREB.