RSS

ANDREW AND JILL'S REAL ESTATE BOARD LATEST 2022 STATS PACK FOR VANCOUVER

The Latest 2022 Market Stats by area are out and available for download. You get the following graphs and charts for both Vancouver East and Vancouver West.

  • Activity Snapshot by Property Type
  • Detached Properties Report and Graph
  • Condo Report and Graph
  • Townhomes Report and Graph
  • Benchmark Price Graph
  • Average Price Per Square Foot

If you are interested in a report like this is for other areas, please contact us to request it and I'll send it to you.

GET THE FULL REPORT

Read

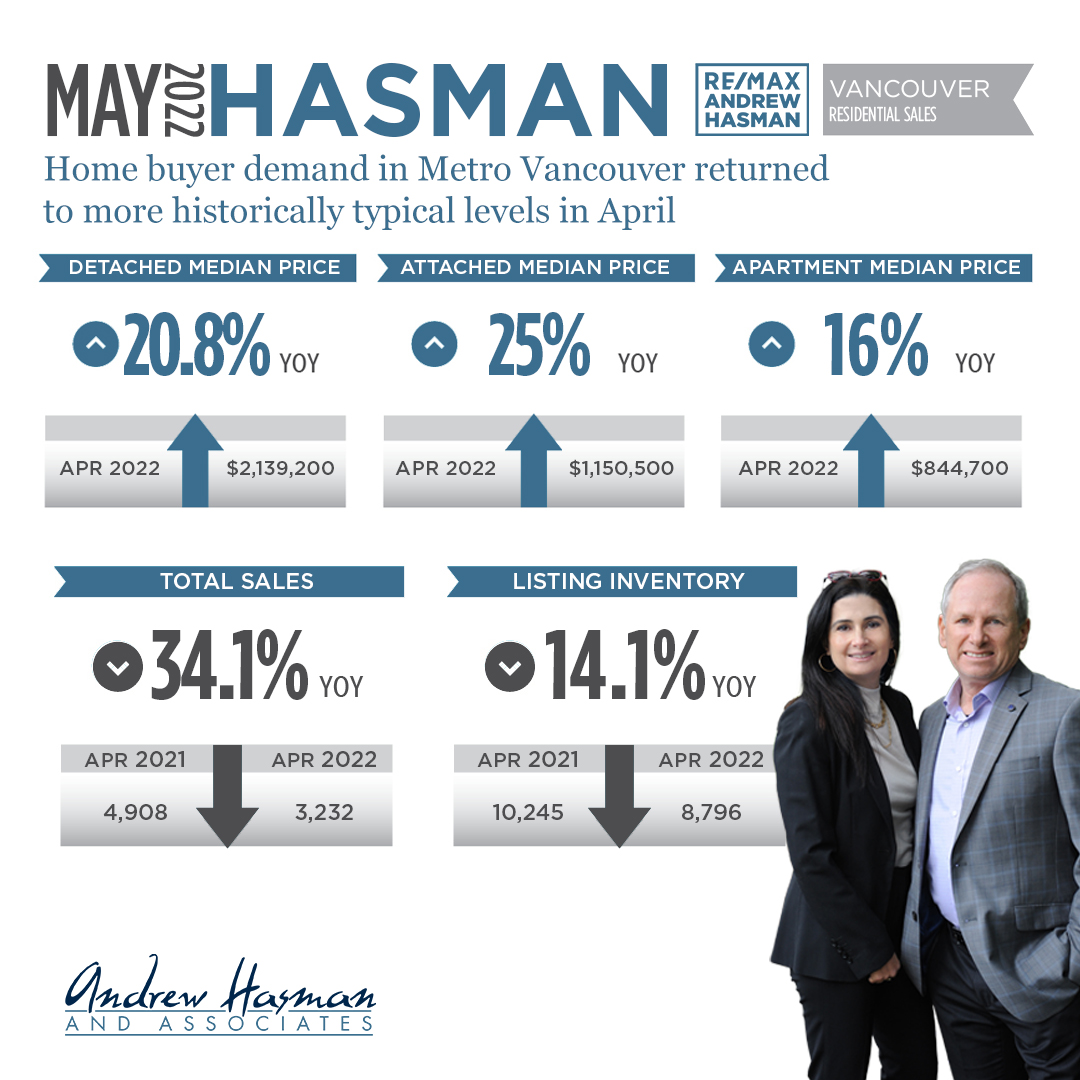
Home buyer demand in Metro Vancouver returned to more historically typical levels in April

The Real Estate Board of Greater Vancouver (REBGV) reports that residential home sales in the region totalled 3,232 in April 2022, a 34.1 per cent decrease from the 4,908 sales recorded in April 2021, and a 25.6 per cent decrease from the 4,344 homes sold in March 2022.

Last month’s sales were 1.5 per cent above the 10-year April sales average.

“So far this spring, we’ve seen home sales ease down from the record-breaking pace of the last year,” Daniel John, REBGV Chair said. “While a small sample size, the return to a more traditional pace of home sales that we’ve experienced over the last two months provides hopeful home buyers more time to make decisions, secure financing and perform other due diligence such as home inspections.”

There were 6,107 detached, attached and apartment properties newly listed for sale on the Multiple Listing Service® (MLS®) in Metro Vancouver in April 2022. This represents a 23.1 per cent decrease compared to the 7,938 homes listed in April 2021 and an 8.5 per cent decrease compared to March 2022 when 6,673 homes were listed.

The total number of homes currently listed for sale on the MLS® system in Metro Vancouver is 8,796, a 14.1 per cent decrease compared to April 2021 (10,245) and a 15.3 per cent increase compared to March 2022 (7,628).

“With interest rates climbing and the total inventory of homes for sale inching higher, it’s important to work with your local Realtor to understand how these factors could affect your home buying or selling situation.” John said.

For all property types, the sales-to-active listings ratio for April 2022 is 36.7 per cent. By property type, the ratio is 25.3 per cent for detached homes, 47.1 per cent for townhomes, and 45 per cent for apartments.

Generally, analysts say downward pressure on home prices occurs when the ratio dips below 12 per cent for a sustained period, while home prices often experience upward pressure when it surpasses 20 per cent over several months.

The MLS® Home Price Index composite benchmark price for all residential properties in Metro Vancouver is currently $1,374,500. This represents an 18.9 per cent increase over April 2021 and a one per cent increase compared to March 2022.

Sales of detached homes in April 2022 reached 962, a 41.9 per cent decrease from the 1,655 detached sales recorded in April 2021. The benchmark price for a detached home is $2,139,200. This represents a 20.8 per cent increase from April 2021 and a one per cent increase compared to March 2022.

Sales of apartment homes reached 1,692 in April 2022, a 26.1 per cent decrease compared to the 2,289 sales in April 2021. The benchmark price of an apartment home is $844,700. This represents a 16 per cent increase from April 2021 and a 1.1 per cent increase compared to March 2022.

Attached home sales in April 2022 totalled 578, a 40 per cent decrease compared to the 964 sales in April 2021. The benchmark price of an attached home is $1,150,500. This represents a 25 per cent increase from April 2021 and a 1.1 per cent increase compared to March 2022.

GET THE FULL REPORT.

Read

ANDREW AND JILL'S REAL ESTATE BOARD LATEST 2022 STATS PACK FOR VANCOUVER

The Latest 2022 Market Stats by area are out and available for download. You get the following graphs and charts for both Vancouver East and Vancouver West.

  • Activity Snapshot by Property Type
  • Detached Properties Report and Graph
  • Condo Report and Graph
  • Townhomes Report and Graph
  • Benchmark Price Graph
  • Average Price Per Square Foot

If you are interested in a report like this is for other areas, please contact us to request it and I'll send it to you.

GET THE FULL REPORT

Read

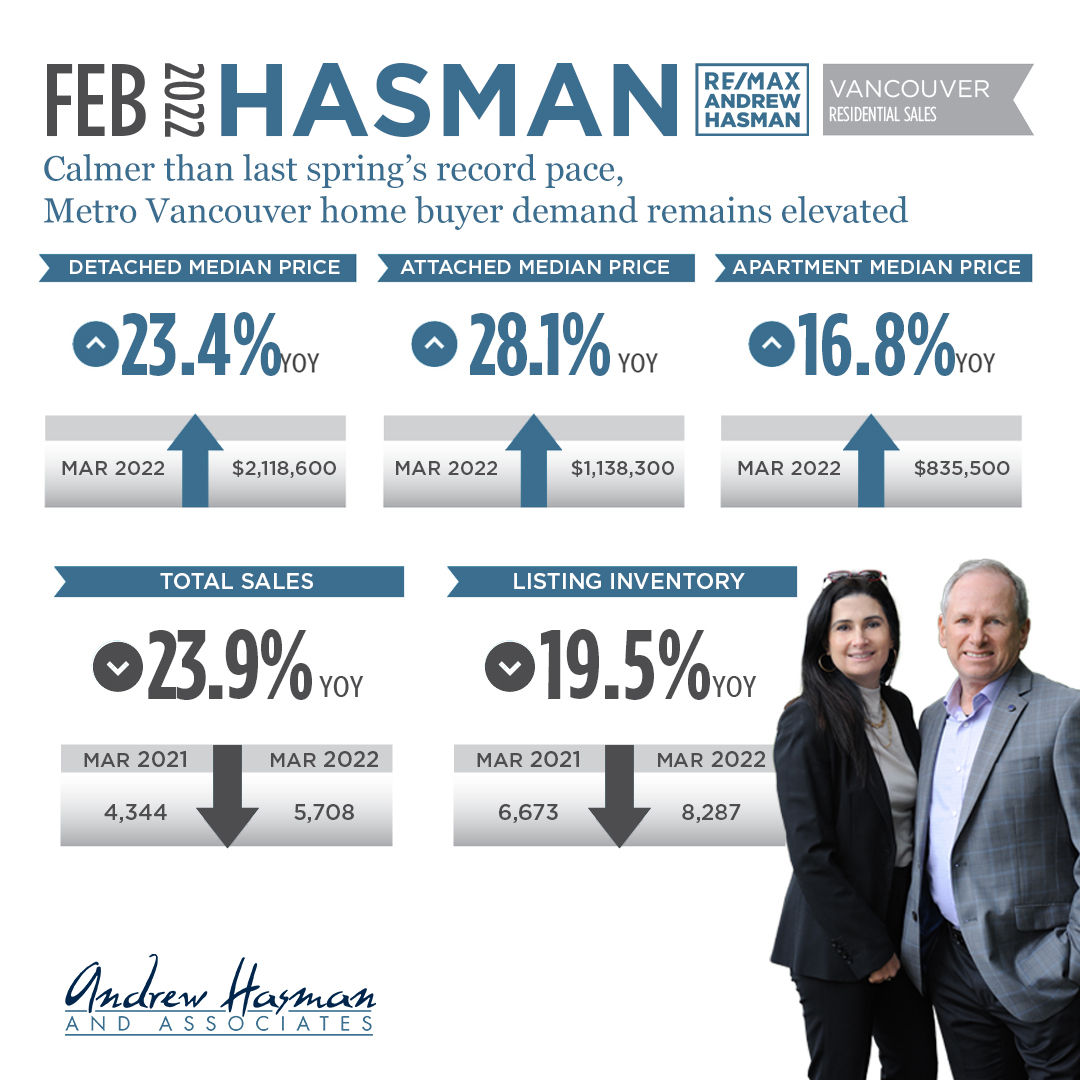
Calmer than last spring’s record pace, Metro Vancouver home buyer demand remains elevated

While down from last year’s record numbers, home sale activity in Metro Vancouver’s housing market remained elevated in March.

The Real Estate Board of Greater Vancouver (REBGV) reports that residential home sales in the region totalled 4,344 in March 2022, a 23.9 per cent decrease from the 5,708 sales recorded in March 2021, and a 26.9 per cent increase from the 3,424 homes sold in February 2022.

Last month’s sales were 25.5 per cent above the 10-year March sales average.

“March of 2021 was the highest selling month in our history. This year’s activity, while still elevated, is happening at a calmer pace than we experienced 12 months ago,” Daniel John, REBGV Chair said. “Home buyers are keeping a close eye on rising interest rates, hoping to make a move before their locked-in rates expire.”

There were 6,673 detached, attached and apartment properties newly listed for sale on the Multiple Listing Service® (MLS®) in Metro Vancouver in March 2022. This represents a 19.5 per cent decrease compared to the 8,287 homes listed in March 2021 and a 22 per cent increase compared to February 2022 when 5,471 homes were listed.

The total number of homes currently listed for sale on the MLS® system in Metro Vancouver is 7,628, a 16.6 per cent decrease compared to March 2021 (9,145) and a 13.1 per cent increase compared to February 2022 (6,742).

“We’re still seeing upward pressure on prices across all housing categories in the region. Lack of supply is driving this pressure,” John said. “The number of homes listed for sale on our MLS® system today is less than half of what’s needed to shift the market into balanced territory.”

For all property types, the sales-to-active listings ratio for March 2022 is 56.9 per cent. By property type, the ratio is 38.8 per cent for detached homes, 73.3 per cent for townhomes, and 70.3 per cent for apartments.

Generally, analysts say downward pressure on home prices occurs when the ratio dips below 12 per cent for a sustained period, while home prices often experience upward pressure when it surpasses 20 per cent over several months.

The MLS® Home Price Index composite benchmark price for all residential properties in Metro Vancouver is currently $1,360,500. This represents a 20.7 per cent increase over March 2021 and a 3.6 per cent increase compared to February 2022.

Sales of detached homes in March 2022 reached 1,291, a 34.3 per cent decrease from the 1,965 detached sales recorded in March 2021. The benchmark price for a detached home is $2,118,600. This represents a 23.4 per cent increase from March 2021 and a 3.6 per cent increase compared to February 2022.

Sales of apartment homes reached 2,310 in March 2022, a 14.3 per cent decrease compared to the 2,697 sales in March 2021. The benchmark price of an apartment home is $835,500. This represents a 16.8 per cent increase from March 2021 and a 3.4 per cent increase compared to February 2022.

Attached home sales in March 2022 totalled 743, a 29.0 per cent decrease compared to the 1,046 sales in March 2021. The benchmark price of an attached home is $1,138,300. This represents a 4.4 per cent increase from March 2021 and a 28.1 per cent increase compared to February 2022.


GET THE FULL REPORT

Read

ANDREW AND JILL'S REAL ESTATE BOARD LATEST 2022 STATS PACK FOR VANCOUVER

The Latest 2022 Market Stats by area are out and available for download. You get the following graphs and charts for both Vancouver East and Vancouver West.

  • Activity Snapshot by Property Type
  • Detached Properties Report and Graph
  • Condo Report and Graph
  • Townhomes Report and Graph
  • Benchmark Price Graph
  • Average Price Per Square Foot

If you are interested in a report like this is for other areas, please contact us to request it and I'll send it to you.

DOWNLOAD VANCOUVER EAST & WEST

Read

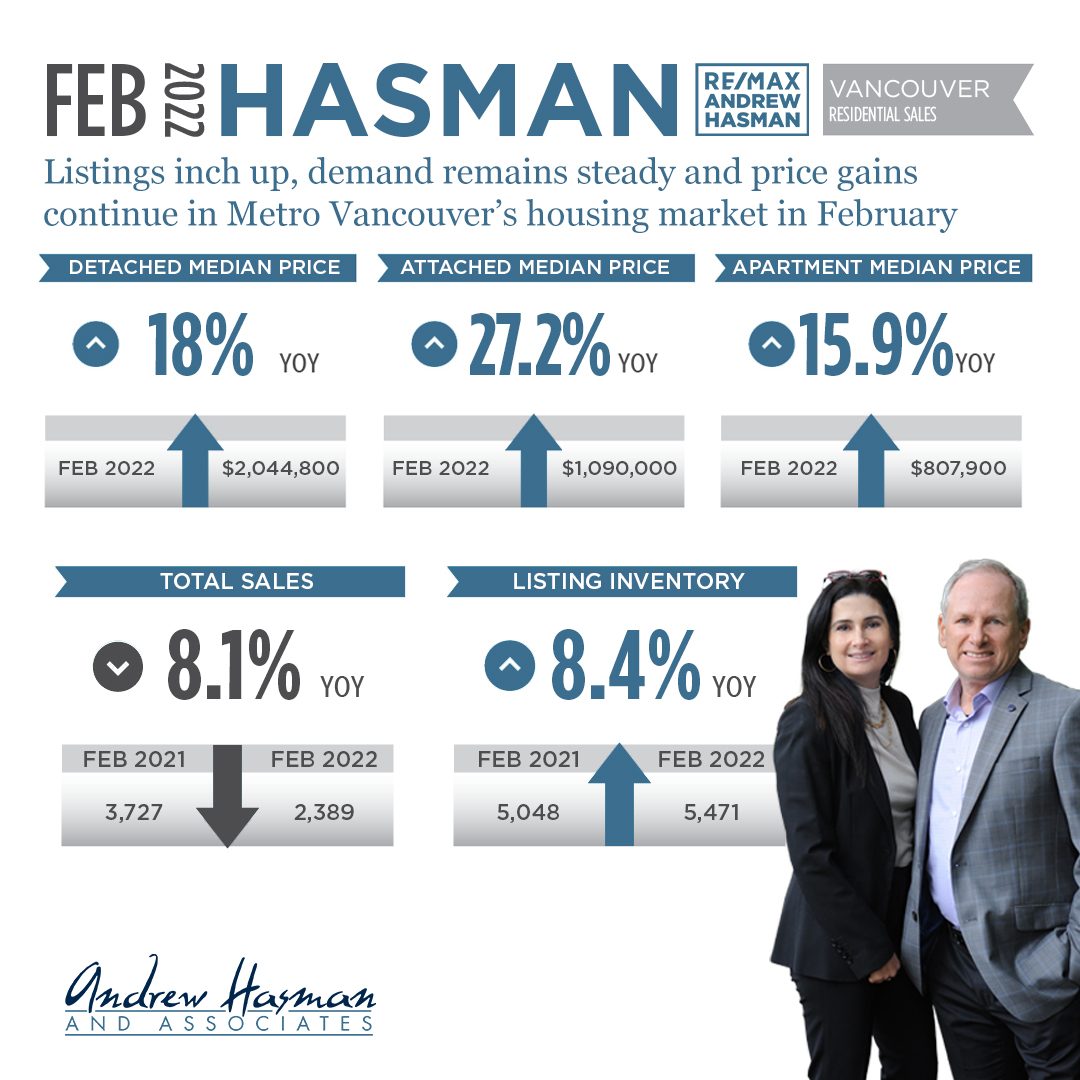
Listings inch up, demand remains steady and price gains continue in Metro Vancouver’s housing market in February

The Metro Vancouver housing market saw steady home sales activity, modest increases in home listings and continued upward trends in pricing in February.

The Real Estate Board of Greater Vancouver (REBGV) reports that residential home sales in the region totalled 3,424 in February 2022, an 8.1 per cent decrease from the 3,727 sales recorded in February 2021, and a 49.8 per cent increase from the 2,285 homes sold in January 2022.

Last month’s sales were 26.9 per cent above the 10-year February sales average.

“As we prepare to enter what’s traditionally the busiest season of the year, the Metro Vancouver housing market is seeing more historically typical home sale activity and a modest uptick in home listing activity compared to last year,” Taylor Biggar, REBGV Chair said.

There were 5,471 detached, attached and apartment properties newly listed for sale on the Multiple Listing Service® (MLS®) in Metro Vancouver in February 2022. This represents an 8.4 per cent increase compared to the 5,048 homes listed in February 2021 and a 31.2 per cent increase compared to January 2022 when 4,170 homes were listed.

The total number of homes currently listed for sale on the MLS® system in Metro Vancouver is 6,742, a 19.3 per cent decrease compared to February 2021 (8,358) and a 19.1 per cent increase compared to January 2022 (5,663).

“Despite having a higher volume of people listing their homes for sale in February, the region’s housing market remains significantly undersupplied, which has been pushing home prices to new highs month after month,” Biggar said.

For all property types, the sales-to-active listings ratio for February 2022 is 50.8 per cent. By property type, the ratio is 34.9 per cent for detached homes, 64.3 per cent for townhomes, and 62.2 per cent for apartments.

Generally, analysts say downward pressure on home prices occurs when the ratio dips below 12 per cent for a sustained period, while home prices often experience upward pressure when it surpasses 20 per cent over several months.

The MLS® Home Price Index composite benchmark price for all residential properties in Metro Vancouver is currently $1,313,400. This represents a 20.7 per cent increase over February 2021 and a 4.6 per cent increase compared to January 2022.

“A lack of housing supply is at the heart of the affordability challenges in Metro Vancouver today. We need more coordinated action from stakeholders at all levels to help create an ample, diverse supply of housing options for residents in the region today and into the future,” Biggar said.

Sales of detached homes in February 2022 reached 1,010, an 18 per cent decrease from the 1,231 detached sales recorded in February 2021. The benchmark price for detached properties is $2,044,800. This represents a 25 per cent increase from February 2021 and a 4.7 per cent increase compared to January 2022.

Sales of apartment homes reached 1,854 in February 2022, a 5.4 per cent increase compared to the 1,759 sales in February 2021. The benchmark price of an apartment property is $807,900. This represents a 15.9 per cent increase from February 2021 and a 4.1 per cent increase compared to January 2022.

Attached home sales in February 2022 totalled 560, a 24 per cent decrease compared to the 737 sales in February 2021. The benchmark price of an attached unit is $1,090,000. This represents a 27.2 per cent increase from February 2021 and a 5.9 per cent increase compared to January 2022.


GET THE FULL REPORT


Read

The First Stats Centre Reoprt of 2022

The Firts Stats Centre Report of 2022 is out and available for download. You get the following graphs and charts for both Vancouver East and Vancouver West.

  • Activity Snapshot by Property Type
  • Detached Properties Report and Graph
  • Condo Report and Graph
  • Townhomes Report and Graph
  • Benchmark Price Graph
  • Average Price Per Square Foot

If you are interested in a report like this is for other areas, please contact us to request it and we'll send it to you.

DOWNLOAD VANCOUVER EAST & WEST

Read

Low supply keeps upward pressure on home prices across Metro Vancouver’s housing market

The first month of 2022 saw home sales come down from last year’s record-setting pace, while low supply continued to cause home prices to edge higher across Metro Vancouver*.

The Real Estate Board of Greater Vancouver (REBGV) reports that residential home sales in the region totalled 2,285 in January 2022, a 4.4 per cent decrease from the 2,389 sales recorded in January 2021, and a 15 per cent decrease from the 2,688 homes sold in December 2021.

Last month’s sales were 25.3 per cent above the 10-year January sales average.

There were 4,170 detached, attached and apartment properties newly listed for sale on the Multiple Listing Service® (MLS®) in Metro Vancouver in January 2022. This represents a 6.9 per cent decrease compared to the 4,480 homes listed in January 2021 and a 114.4 per cent increase compared to December 2021 when 1,945 homes were listed.  

“Our listing inventory on MLS® is less than half of what would be optimal to begin the year. As a result, hopeful home buyers have limited choice in the market today. This trend is causing fierce competition for a scarce number of homes for sale, which, in turn, increases prices,” Keith Stewart, REBGV economist said.


GET THE FULL REPORT
Read

The Last Stats Centre Report of 2021

The Last Stats Centre Report of 2021 is out and available for download. You get the following graphs and charts for both Vancouver East and Vancouver West.

  • Activity Snapshot by Property Type
  • Detached Properties Report and Graph
  • Condo Report and Graph
  • Townhomes Report and Graph
  • Benchmark Price Graph
  • Average Price Per Square Foot

If you are interested in a report like this is for other areas, please contact us to request it and we'll send it to you.

DOWNLOAD VANCOUVER EAST & WEST

Read

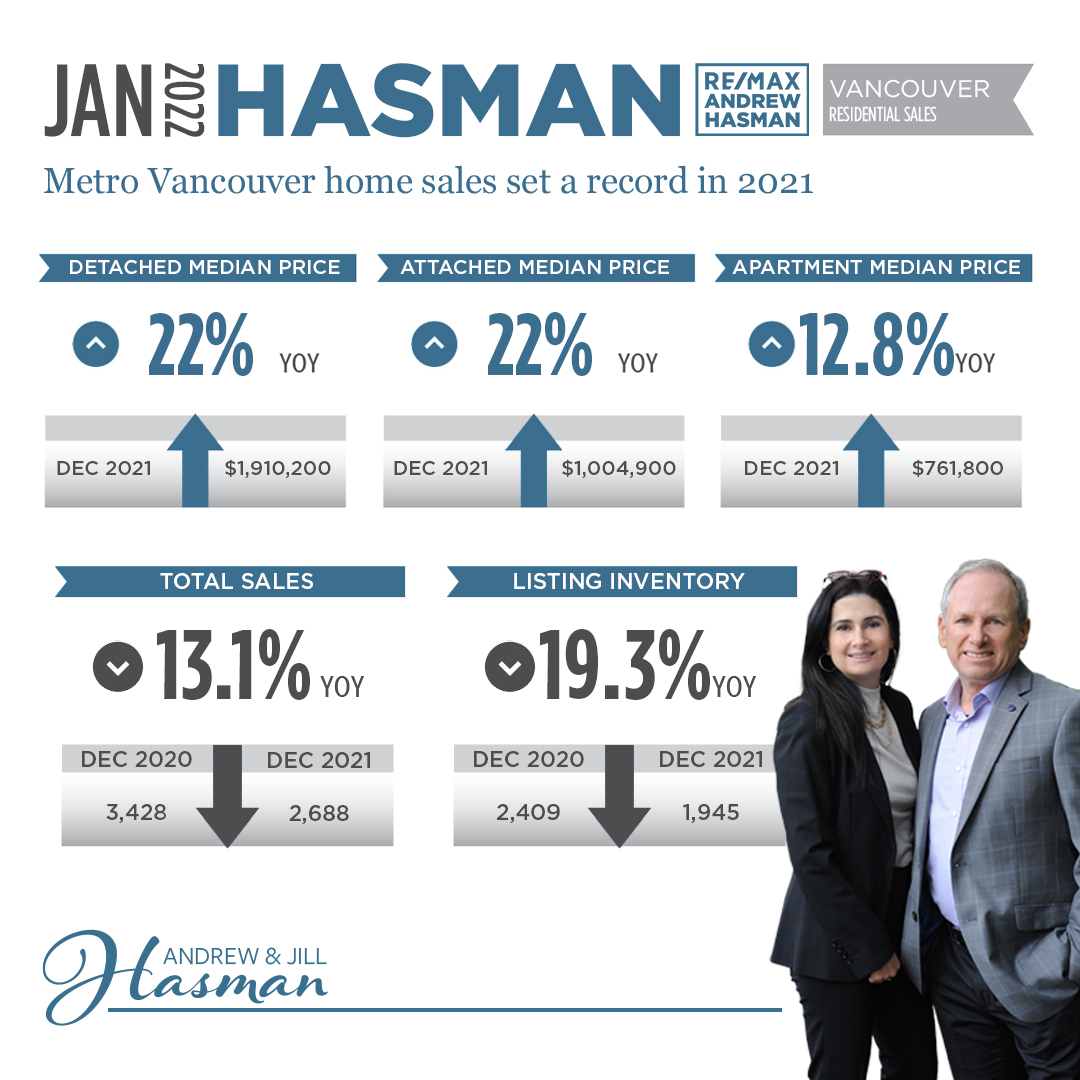
Metro Vancouver home sales set a record in 2021

Metro Vancouver home sales reached an all-time high in 2021 as housing needs remained a top priority for residents in the second year of the COVID-19 pandemic.

The Real Estate Board of Greater Vancouver (REBGV) reports that residential home sales in the region totalled 43,999 in 2021, a 42.2 per cent increase from the 30,944 sales recorded in 2020, a 73.6 per cent increase from the 25,351 homes sold in 2019, and a four per cent increase over the previous all-time sales record of 42,326 set in 2015.

Last year’s sales total was 33.4 per cent above the 10-year sales average.

“Home has been a focus for residents throughout the pandemic. With low interest rates, increased household savings, more flexible work arrangements, and higher home prices than ever before, Metro Vancouverites, in record numbers, are assessing their housing needs and options,” Keith Stewart, REBGV economist said.

Home listings on the Multiple Listing Service® (MLS®) in Metro Vancouver reached 62,265 in 2021. This is a 14.7 per cent increase compared to the 54,305 homes listed in 2020 and a 19.9 per cent increase compared to the 51,918 homes listed in 2019.

Last year’s listings total was 11 per cent above the 10-year average.

“While steady, home listing activity didn't keep pace with the record demand we saw throughout 2021. This imbalance caused residential home prices to rise over the past 12 months,” Stewart said.

The total number of homes currently listed for sale on the MLS® system in Metro Vancouver is 5,236, a 38.7 per cent decrease compared to December 2020 (8,538) and a 26.7 per cent decrease compared to November 2021 (7,144).

“We begin 2022 with just over 5,000 homes for sale across the region. This is the lowest level we’ve seen in more than 30 years,” Stewart said. “With demand at record levels, residents shouldn’t expect home price growth to relent until there’s a more adequate supply of housing available to purchase.”

The MLS® HPI composite benchmark price for all residential properties in Metro Vancouver ends the year at $1,230,200. This is a 17.3 per cent increase compared to December 2020.

Both detached home and townhome benchmark prices increased 22 per cent in the region last year, while apartments increased 12.8 per cent.

Looking across Metro Vancouver, Maple Ridge saw the largest increase in benchmark prices at 34.7 per cent, followed by Pitt Meadows (29.8 per cent), and Whistler (27.8 per cent).

Looking at area and property type, detached homes in Pitt Meadows saw the largest benchmark price increase at 42.2 per cent, followed by detached homes (38.5 per cent) and townhomes (35.2 per cent) in Maple Ridge.

December summary

REBGV reports that residential home sales in the region totalled 2,688 in December 2021, a 13.1 per cent decrease from the 3,093 sales recorded in December 2020, and a 21.6 per cent decrease from the 3,428 homes sold in November 2021.

Last month’s sales were 33.4 per cent above the 10-year December sales average.

There were 1,945 detached, attached and apartment properties newly listed for sale on the MLS® in Metro Vancouver in December 2021. This represents a 19.3 per cent decrease compared to the 2,409 homes listed in December 2020 and a 50.9 per cent decrease compared to November 2021 when 3,964 homes were listed.

For all property types, the sales-to-active listings ratio for December 2021 is 51.3 per cent. By property type, the ratio is 35.1 per cent for detached homes, 75.6 per cent for townhomes, and 60.8 per cent for apartments.

Generally, analysts say downward pressure on home prices occurs when the ratio dips below 12 per cent for a sustained period, while home prices often experience upward pressure when it surpasses 20 per cent over several months.

Sales of detached homes in December 2021 reached 794, a 22.6 per cent decrease from the 1,026 sales recorded in December 2020. The benchmark price for a detached home is $1,910,200. This represents a 22 per cent increase from December 2020 and a 2.1 per cent increase compared to November 2021.

Sales of apartment homes reached 1,464 in December 2021, a 1.4 per cent decrease compared to the 1,474 sales in December 2020. The benchmark price of an apartment home is $761,800. This represents a 12.8 per cent increase from December 2020 and a 1.2 per cent increase compared to November 2021.

Attached home sales in December 2021 totalled 430, a 27.5 per cent decrease compared to the 593 sales in December 2020. The benchmark price of an attached home is $1,004,900. This represents a 22 per cent increase from December 2020 and a 1.5 per cent increase compared to November 2021.


DOWNLOAD THE FULL PDF REPORT

Read
Reciprocity Logo The data relating to real estate on this website comes in part from the MLS® Reciprocity program of either the Greater Vancouver REALTORS® (GVR), the Fraser Valley Real Estate Board (FVREB) or the Chilliwack and District Real Estate Board (CADREB). Real estate listings held by participating real estate firms are marked with the MLS® logo and detailed information about the listing includes the name of the listing agent. This representation is based in whole or part on data generated by either the GVR, the FVREB or the CADREB which assumes no responsibility for its accuracy. The materials contained on this page may not be reproduced without the express written consent of either the GVR, the FVREB or the CADREB.