The month-over-month price gains seen earlier this year abated in the Metro Vancouver1 housing market in September due to a seasonal decline in sales and a modest increase in inventory levels across the region.
The Real Estate Board of Greater Vancouver (REBGV) reports that residential home sales in the region totalled 1,926 in September 2023, a 13.2 per cent increase from the 1,701 sales recorded in September 2022. This was 26.3 per cent below the 10-year seasonal average (2,614).
There were 5,446 detached, attached and apartment properties newly listed for sale on the Multiple Listing Service® (MLS®) in Metro Vancouver in September 2023. This represents a 28.4 per cent increase compared to the 4,243 homes listed in September 2022.
This was 5.2 per cent above the 10-year seasonal average (5,179).
The total number of homes currently listed for sale on the MLS® system in Metro Vancouver is 11,382, a 9.2 per cent increase compared to September 2022 (10,427). This was 6.2 per cent below the 10-year seasonal average (12,136).
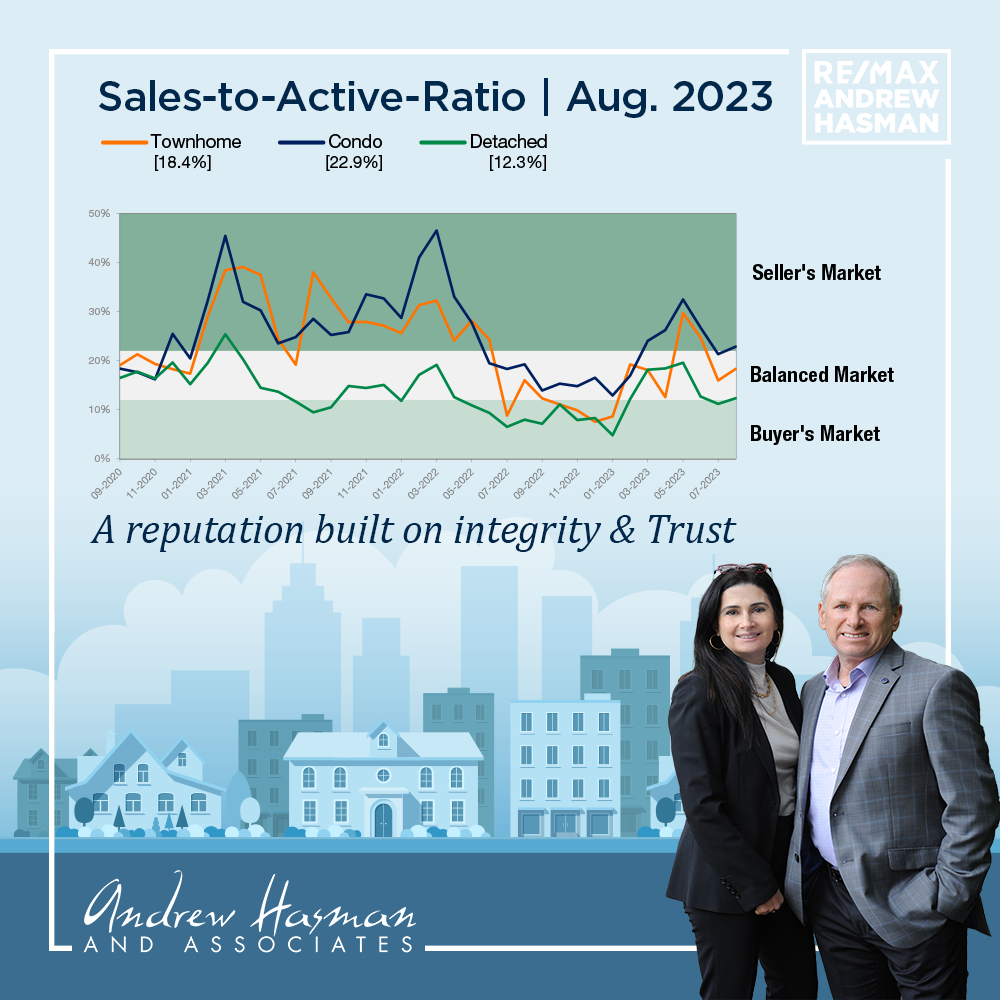
Across all detached, attached and apartment property types, the sales-to-active listings ratio for September 2023 is 17.7 per cent. By property type, the ratio is 12.6 per cent for detached homes, 21.6 per cent for townhomes, and 21.3 per cent for apartments.
Analysis of the historical data suggests downward pressure on home prices occurs when the ratio dips below 12 per cent for a sustained period, while home prices often experience upward pressure when it surpasses 20 per cent over several months.
“In contrast to the spring and summer, the September data suggests there may be a renewed interest on the part of sellers to participate in the market, with new listing activity rising back in line with long-term historical averages. This upward shift in new listings has allowed overall inventory levels to recover modestly from the low levels we saw earlier this year,” Lis said. “When we pair this dynamic with the slowdown in sales that typically occurs in the fall as a result of seasonal patterns, the outcome is more balanced market conditions overall.”
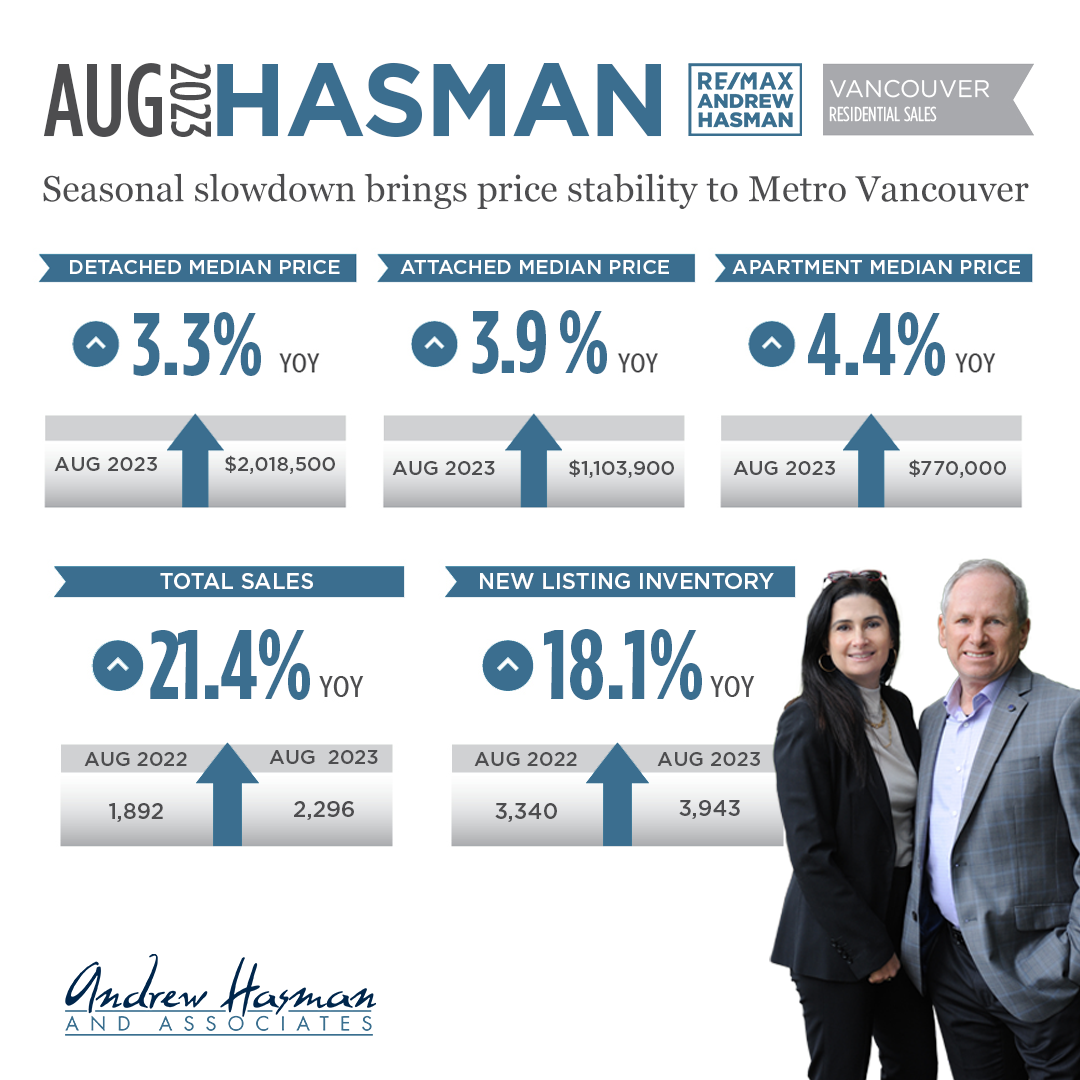
The MLS® Home Price Index composite benchmark price for all residential properties in Metro Vancouver is currently $1,203,300. This represents a 4.4 per cent increase over September 2022 and a 0.4 per cent decrease compared to August 2023.
Sales of detached homes in September 2023 reached 572, a 7.5 per cent increase from the 532 detached sales recorded in September 2022. The benchmark price for a detached home is $2,017,100. This represents a 5.8 per cent increase from September 2022 and a 0.1 per cent decrease compared to August 2023.
Sales of apartment homes reached 988 in September 2023, an 11.3 per cent increase compared to the 888 sales in September 2022. The benchmark price of an apartment home is $768,500. This represents a 5.8 per cent increase from September 2022 and a 0.2 per cent decrease compared to August 2023.
Attached home sales in September 2023 totalled 352, a 28.5 per cent increase compared to the 274 sales in September 2022. The benchmark price of an attached home is $1,098,400. This represents a 5.3 per cent increase from September 2022 and a 0.5 per cent decrease compared to August 2023.