RSS

Andrew and Jill's September 2023 Stats Pack East and West from the Vancouver Real Estate Board.

The Latest 2023 Market Stats by area are out and available for download. You get the following graphs and charts for both Vancouver East and Vancouver West.

  • Activity Snapshot by Property

  • Type Detached Properties Report and Graph

  • Condo Report and Graph

  • Townhomes Report and Graph

  • Benchmark Price Graph

  • Average Price Per Square Foot

GET THE VANCOUVER EAST & WEST REPORT

If you are interested in a report like this is for other areas, please contact us to request it and I'll send it to you.

Read

Seasonal slowdown brings price stability to Metro Vancouver

As summer winds to a close, higher borrowing costs have begun to permeate the Metro Vancouver housing market in predictable ways, with price gains cooling and sales slowing along the typical seasonal pattern.

The Real Estate Board of Greater Vancouver (REBGV) reports that residential home sales in the region totalled 2,296 in August 2023, a 21.4 per cent increase from the 1,892 sales recorded in August 2022. This was 13.8 per cent below the 10-year seasonal average (2,663).

“It’s been an interesting spring and summer market, to say the least” Andrew Lis, REBGV’s director of economics and data analytics said. “Borrowing costs are fluctuating around the highest levels we’ve seen in over ten years, yet Metro Vancouver’s housing market bucked many pundits’ predictions of a major slowdown, instead posting relatively strong sales numbers and year-to-date price gains north of eight per cent, regardless of home type.”

There were 3,943 detached, attached and apartment properties newly listed for sale on the Multiple Listing Service® (MLS®) in Metro Vancouver in August 2023. This represents an 18.1 per cent increase compared to the 3,340 homes listed in August 2022. This was 5.3 per cent below the 10-year seasonal average (4,164).

The total number of homes currently listed for sale on the MLS® system in Metro Vancouver is 10,082, a 0.2 per cent decrease compared to August 2022 (10,099). This was 13.4 per cent below the 10-year seasonal average (11,647).

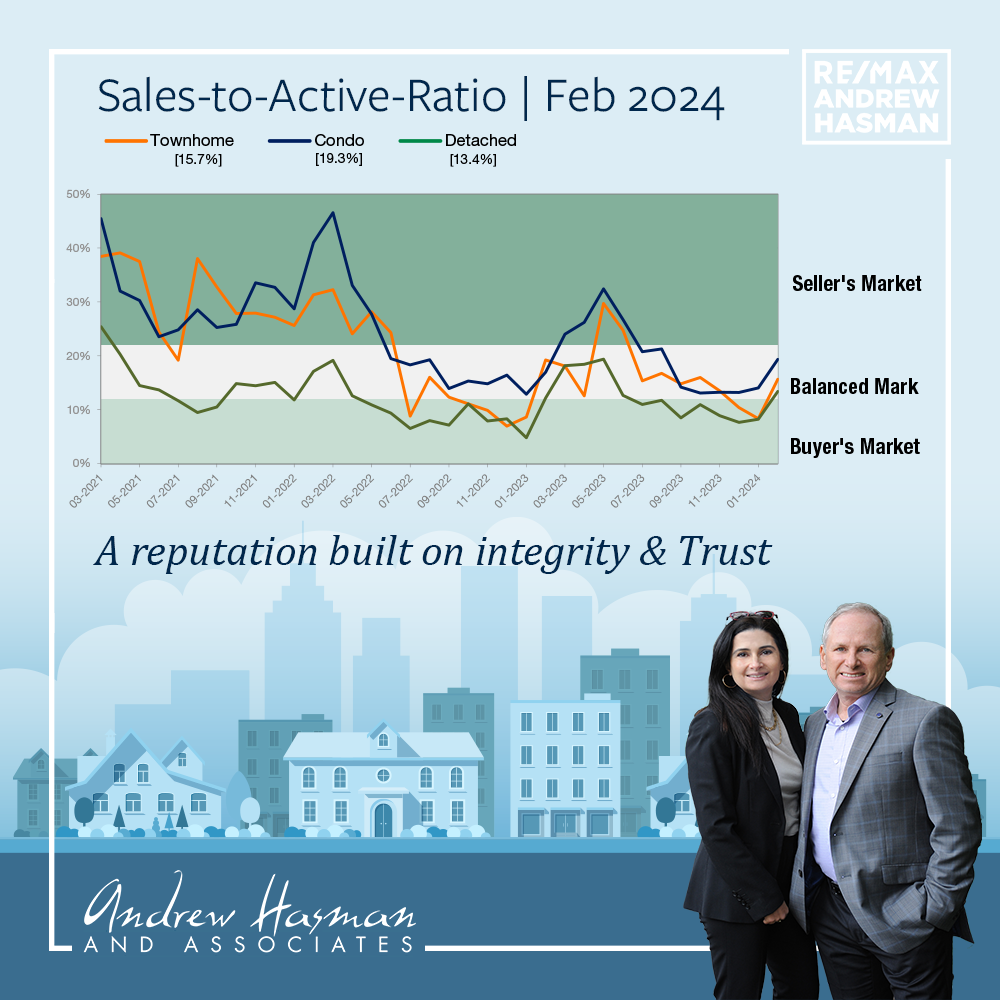
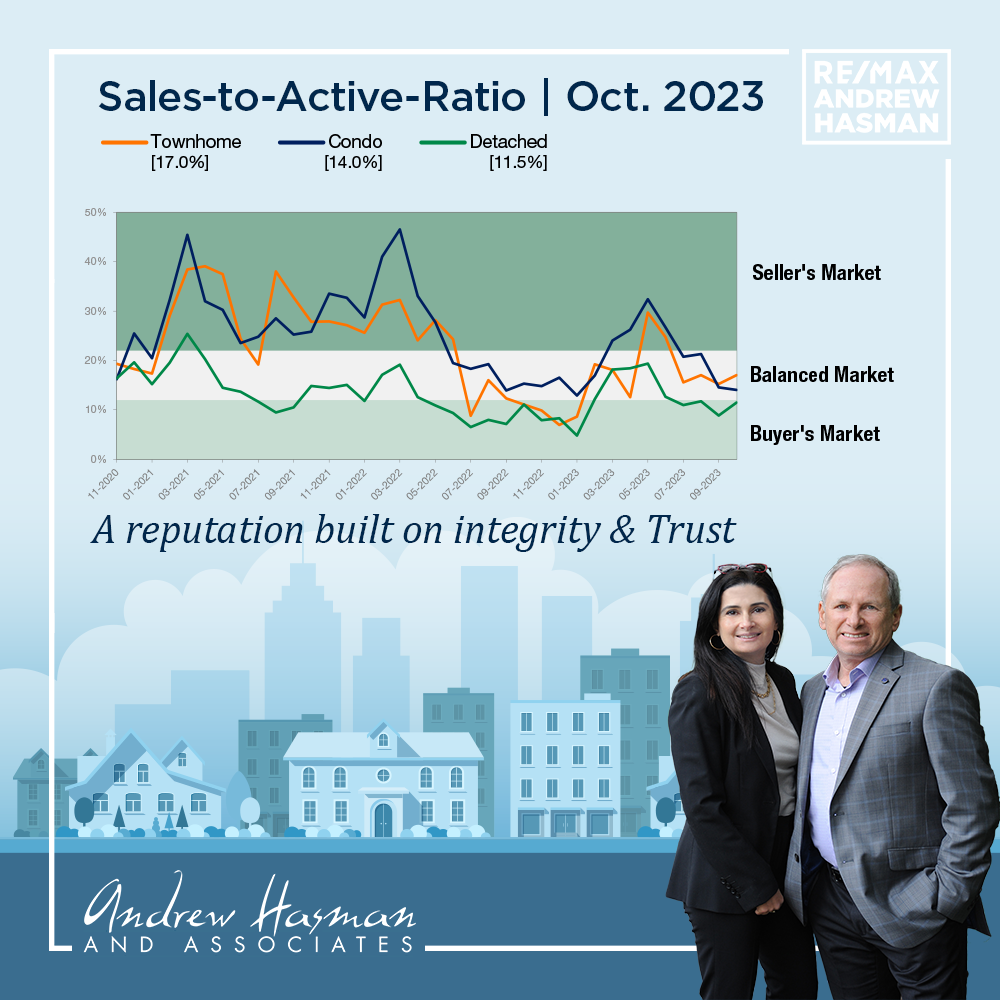
Across all detached, attached and apartment property types, the sales-to-active listings ratio for August 2023 is 23.9 per cent. By property type, the ratio is 14.2 per cent for detached homes, 30.3 per cent for townhomes, and 31.9 per cent for apartments.

Analysis of the historical data suggests downward pressure on home prices occurs when the ratio dips below 12 per cent for a sustained period, while home prices often experience upward pressure when it surpasses 20 per cent over several months.

“It’s a bit of a tortoise and hare story this year, with sales starting the year slowly while prices increased due to low inventory levels,” Lis said. “As fall approaches, sales have caught up with the price gains, but both metrics are now slowing to a pace that is more in-line with historical seasonal patterns, and with what one might expect given that borrowing costs are where they are.”

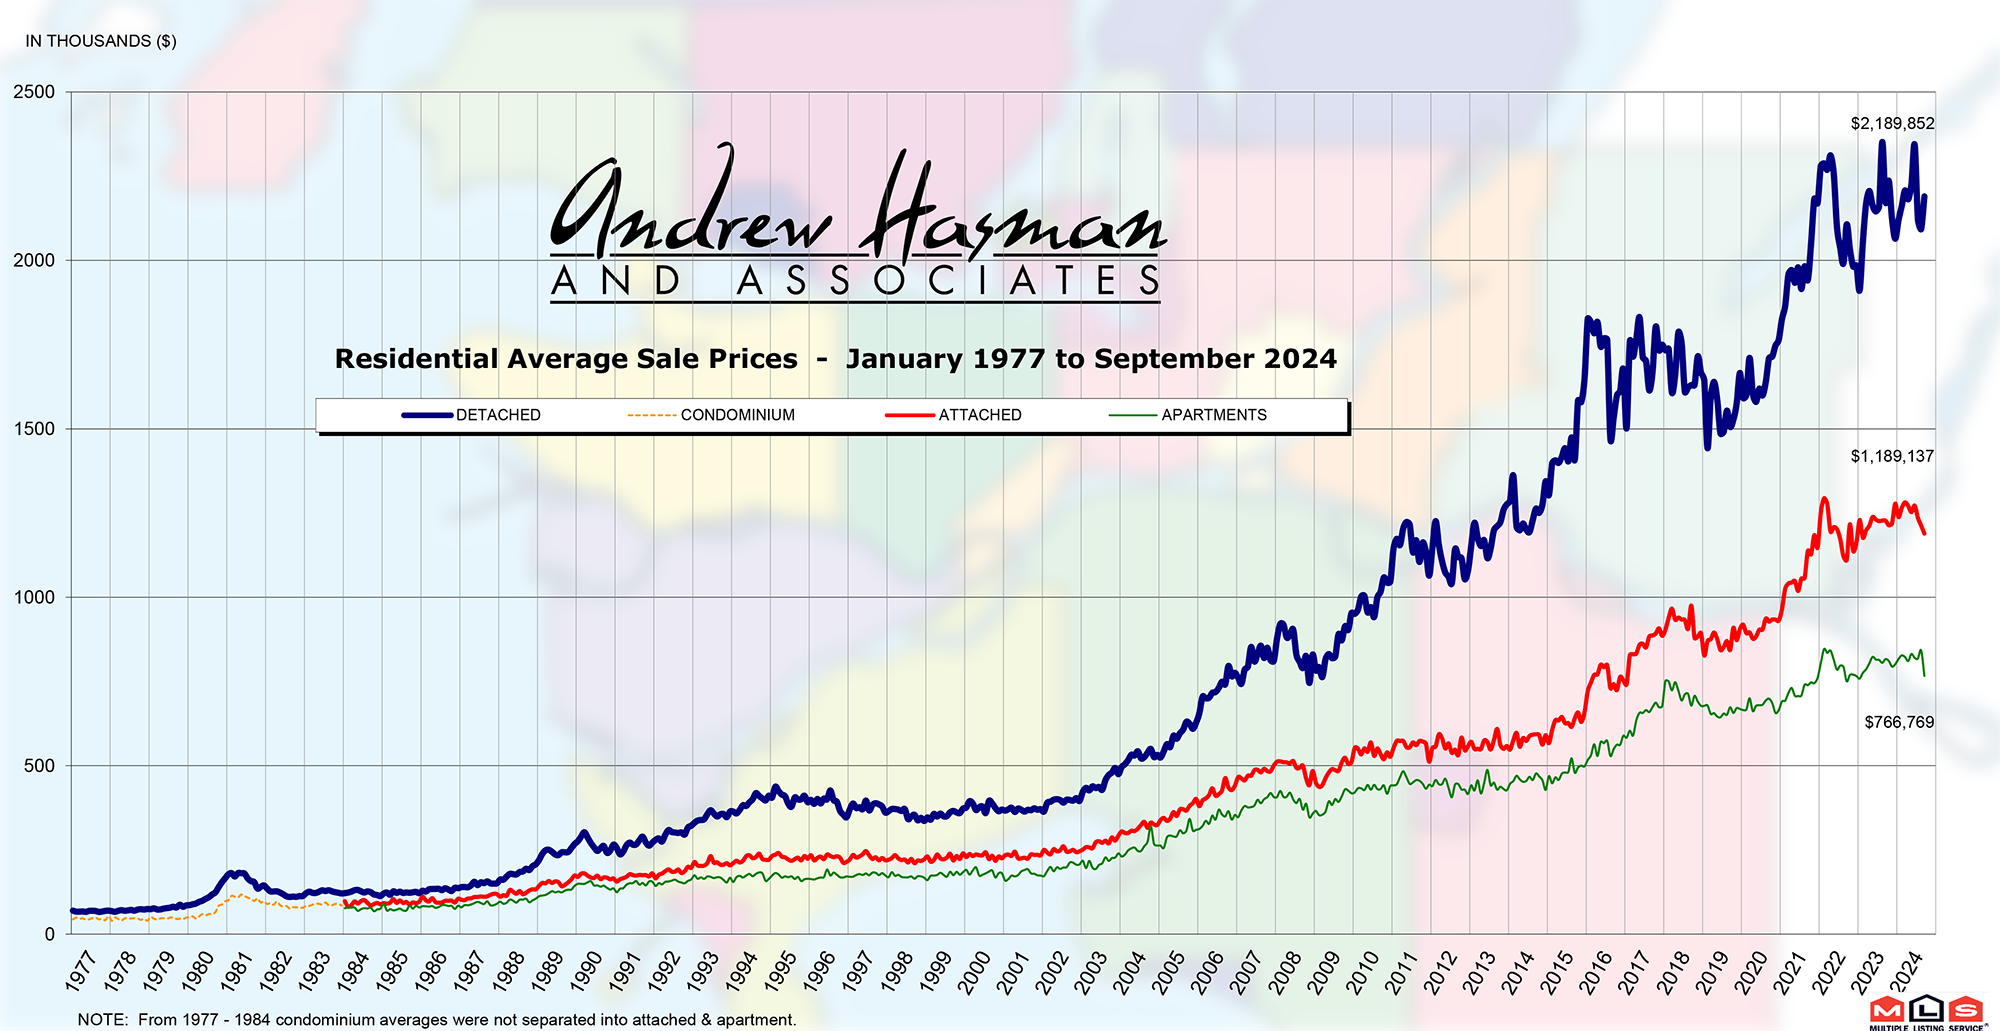
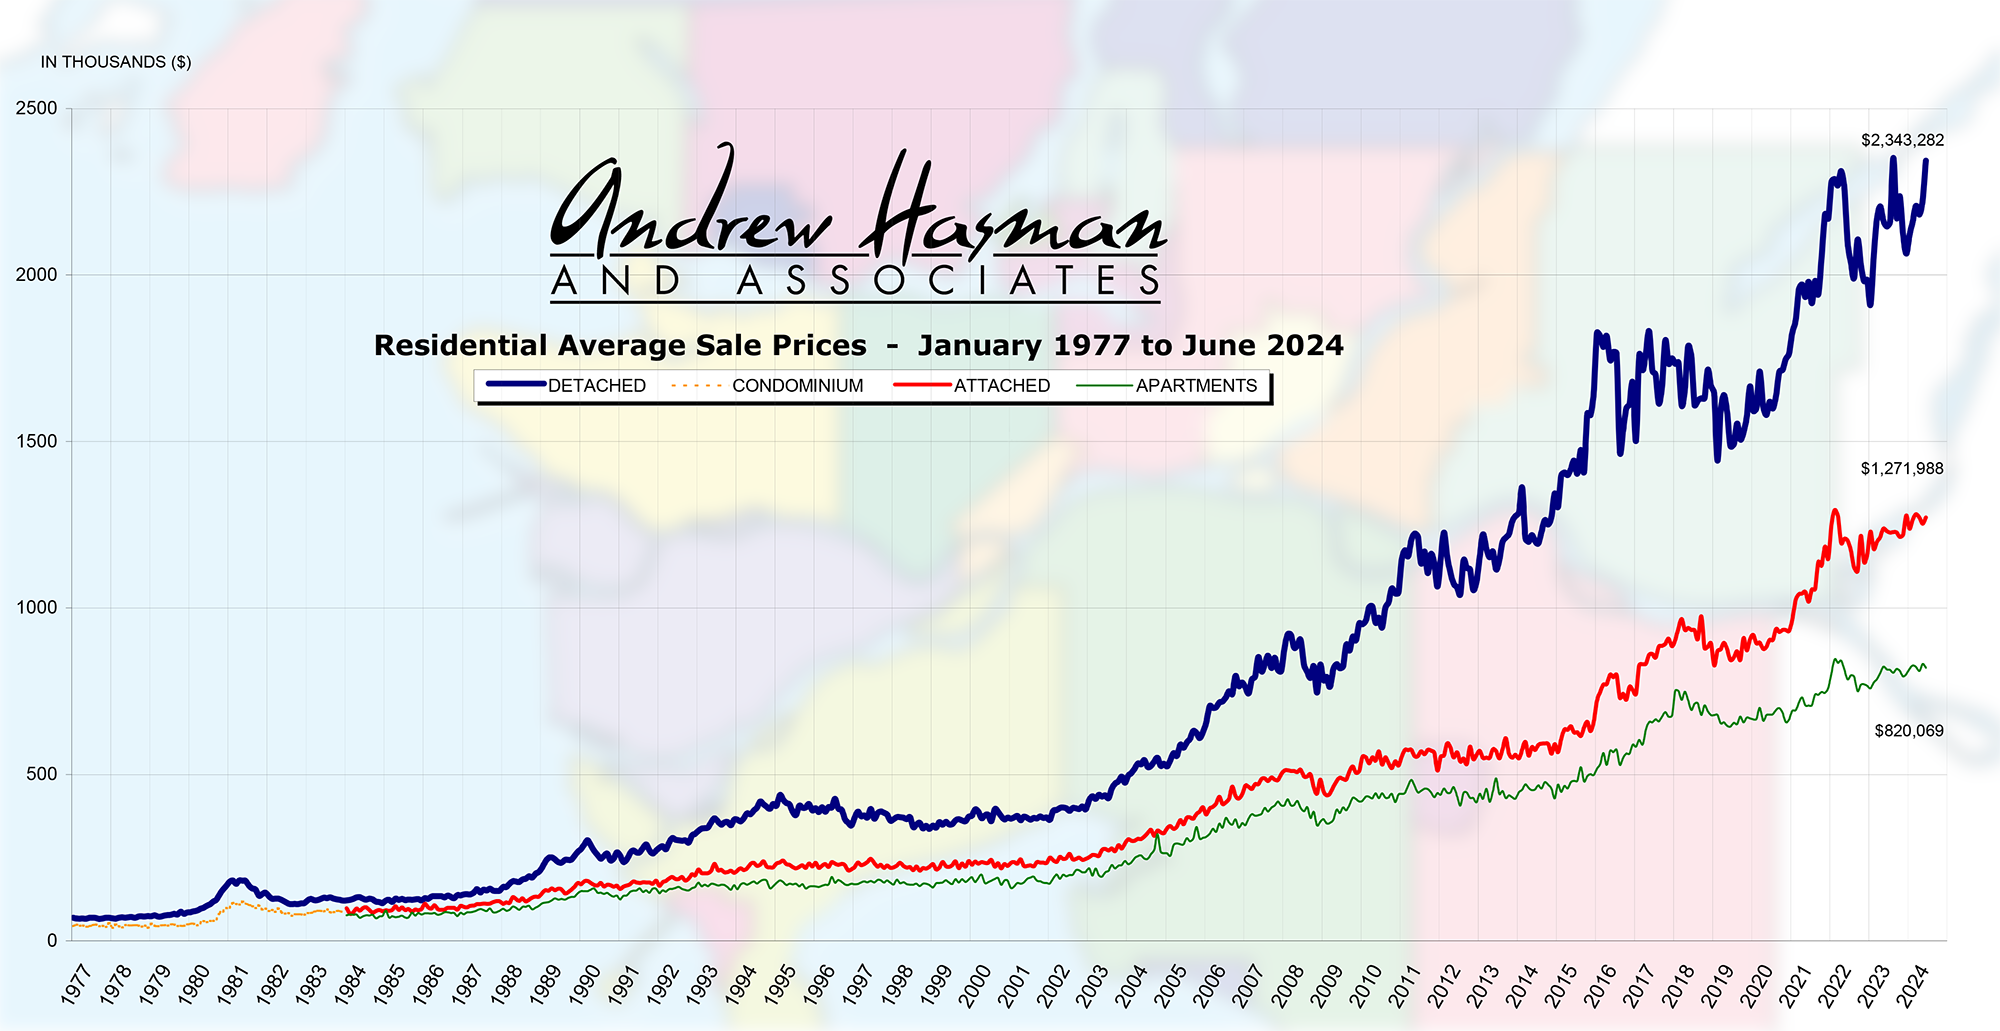
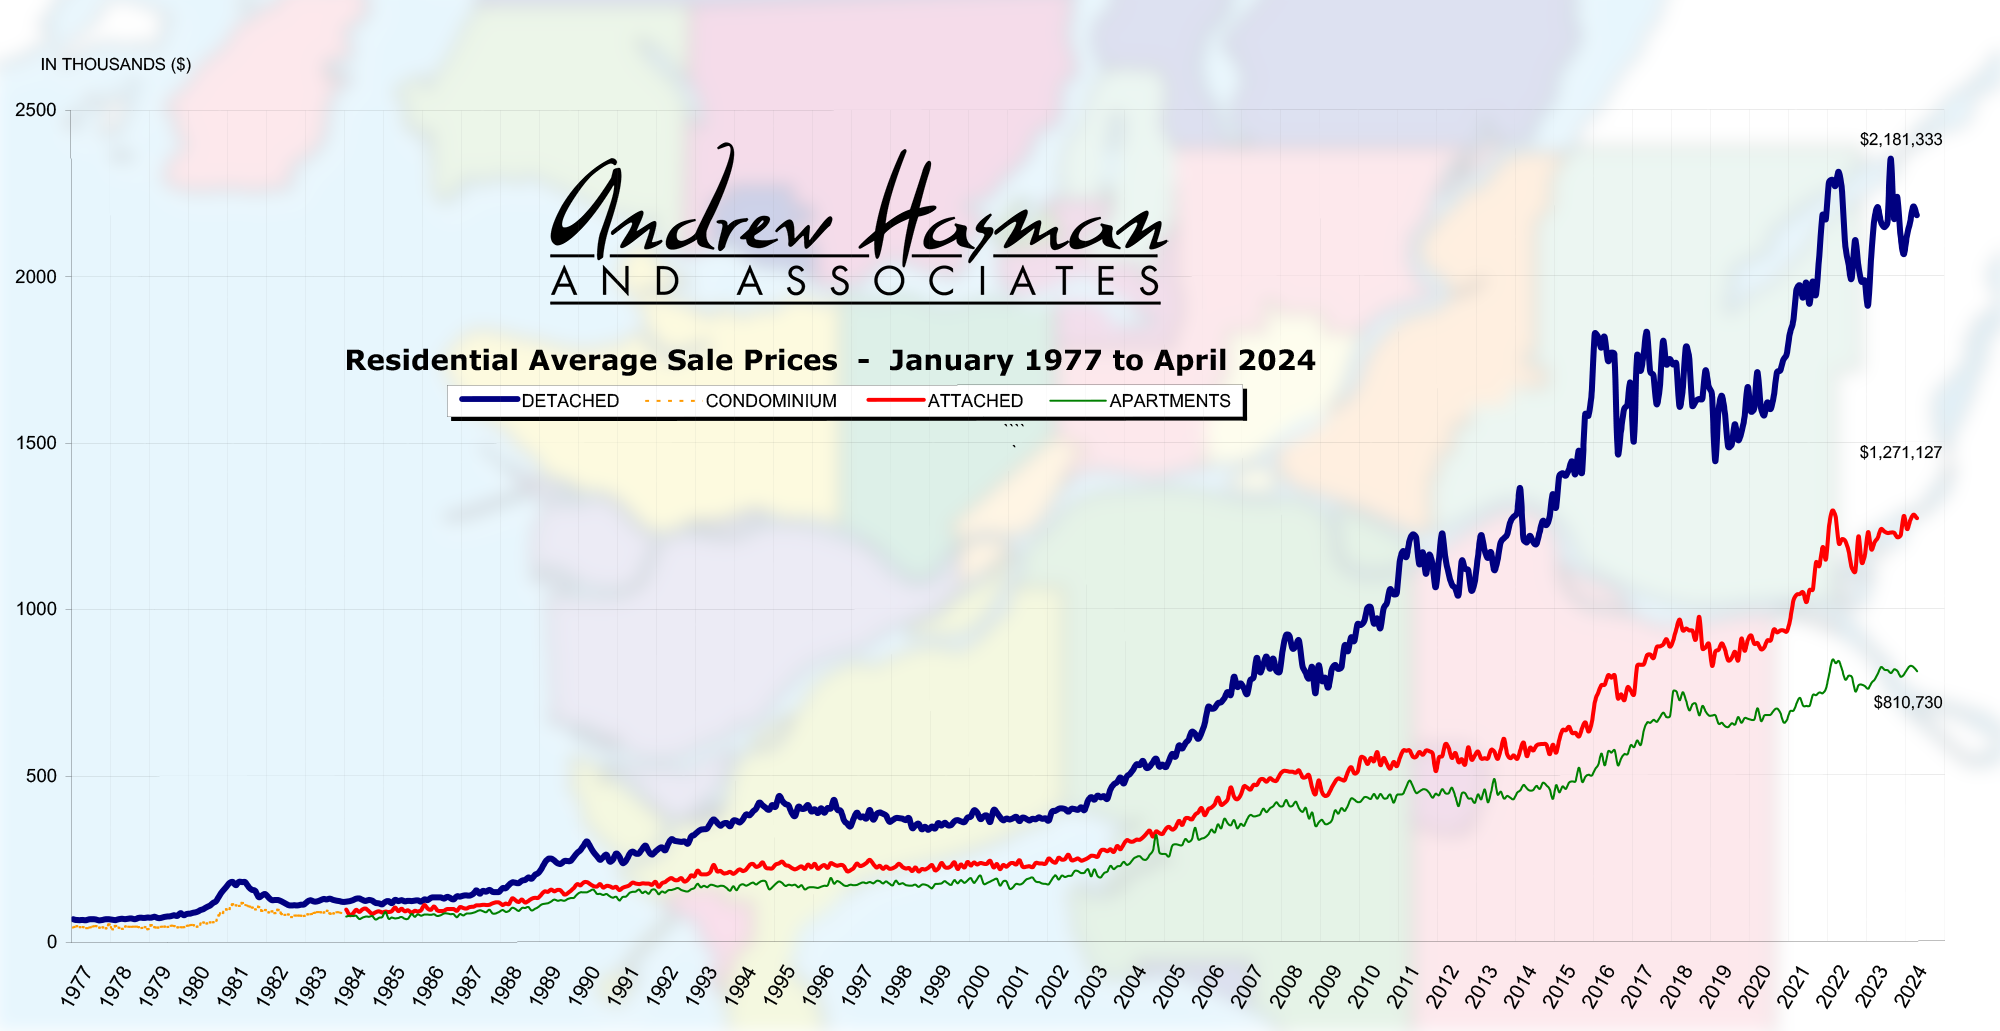
The MLS® Home Price Index composite benchmark price for all residential properties in Metro Vancouver is currently $1,208,400. This represents a 2.5 per cent increase over August 2022 and a 0.2 per cent decrease compared to July 2023.

Sales of detached homes in August 2023 reached 591, a 13.2 per cent increase from the 522 detached sales recorded in August 2022. The benchmark price for a detached home is $2,018,500. This represents a 3.3 per cent increase from August 2022 and a 0.3 per cent increase compared to July 2023.

Sales of apartment homes reached 1,270 in August 2023, a 27.4 per cent increase compared to the 997 sales in August 2022. The benchmark price of an apartment home is $770,000. This represents a 4.4 per cent increase from August 2022 and a 0.2 per cent decrease compared to July 2023.

Attached home sales in August 2023 totalled 422, an 18.9 per cent increase compared to the 355 sales in August 2022. The benchmark price of an attached home is $1,103,900. This represents a 3.9 per cent increase from August 2022 and a 0.1 per cent decrease compared to July 2023.

Read

Andrew and Jill's August 2023 Stats Pack East and West from the Vancouver Real Estate Board.

The Latest 2023 Market Stats by area are out and available for download. You get the following graphs and charts for both Vancouver East and Vancouver West.

  • Activity Snapshot by Property

  • Type Detached Properties Report and Graph

  • Condo Report and Graph

  • Townhomes Report and Graph

  • Benchmark Price Graph

  • Average Price Per Square Foot

GET THE VANCOUVER EAST & WEST REPORT

If you are interested in a report like this is for other areas, please contact us to request it and I'll send it to you.

Read

Strong sales push Metro Vancouver home prices past the rate hike in July

Home prices across all home types in Metro Vancouver1 rose again in July, as strong sales figures continue to push up against low levels of housing inventory in the region.

The Real Estate Board of Greater Vancouver (REBGV) reports that residential home sales in the region totalled 2,455 in July 2023, a 28.9 per cent increase from the 1,904 sales recorded in July 2022. This was 15.6 per cent below the 10-year seasonal average (2,909).

“While sales remain about 15 per cent below the ten-year average, they are also up about 30 per cent year-over-year, which is not insignificant,” Andrew Lis, REBGV’s director of economics and data analytics said. “Looking under the hood of these figures, it’s easy to see why sales are posting such a large year-over-year percentage increase. Last July marked the point when the Bank of Canada announced their ‘super-sized’ increase to the policy rate of one full per cent, catching buyers and sellers off guard, and putting a chill on market activity at that time.”

There were 4,649 detached, attached and apartment properties newly listed for sale on the Multiple Listing Service® (MLS®) in Metro Vancouver in July 2023. This represents a 17 per cent increase compared to the 3,975 homes listed in July 2022. This was 5.2 per cent below the 10-year seasonal average (4,902).

The total number of homes currently listed for sale on the MLS® system in Metro Vancouver is 10,301, a four per cent decrease compared to July 2022 (10,734). This was 14.4 per cent below the 10-year seasonal average (12,039).

Across all detached, attached and apartment property types, the sales-to-active listings ratio for July 2023 is 24.9 per cent. By property type, the ratio is 16.5 per cent for detached homes, 32 per cent for townhomes, and 30.6 per cent for apartments.

Analysis of the historical data suggests downward pressure on home prices occurs when the ratio dips below 12 per cent for a sustained period, while home prices often experience upward pressure when it surpasses 20 per cent over several months.

“What’s interesting to see in the current market environment is that, while the Bank of Canada rate hike this July was only a quarter of a per cent, mortgage rates are now at the highest levels we’ve seen in Canada in over ten years,” Lis said. “Yet despite borrowing costs being even higher than last July, sales activity surpassed the levels we saw last year, which I think says a lot about the strength of demand in our market and buyers’ ability to adapt to and qualify for higher borrowing costs.”

The MLS® Home Price Index composite benchmark price for all residential properties in Metro Vancouver is currently $1,210,700. This represents a 0.5 per cent increase over July 2022 and a 0.6 per cent increase compared to June 2023.

Sales of detached homes in July 2023 reached 681, a 28.7 per cent increase from the 529 detached sales in July 2022. The benchmark price for a detached home is $2,012,900. This represents a 0.6 per cent increase from July 2022 and a 1.1 per cent increase compared to June 2023.

Sales of apartment homes reached 1,281 in July 2023, a 20.7 per cent increase compared to the 1,061 sales in July 2022. The benchmark price of an apartment home is $771,600. This represents a 2.6 per cent increase from July 2022 and a 0.6 per cent increase compared to June 2023.

Attached home sales in July 2023 totalled 466, a 53.3 per cent increase compared to the 304 sales in July 2022. The benchmark price of an attached home is $1,104,600. This represents a 1.2 per cent increase from July 2022 and a 0.5 per cent increase compared to June 2023.

GET THE FULL REPORT

Read

Competition among buyers in Metro Vancouver’s housing market heats up as summer arrives

VANCOUVER, BC – May 2, 2023 – With listing activity remaining below historical norms, home sales in Metro Vancouver1 have mounted a surprising comeback, rising near levels seen last spring, before eight consecutive interest rate hikes eroded borrowing power and brought home sales activity down along with it.


The Real Estate Board of Greater Vancouver (REBGV) reports that residential home sales in the region totalled 2,7412 in April 2023, a 16.5 per cent decrease from the 3,281 sales recorded in April 2022, and 15.6 per cent below the 10-year seasonal average (3,249).

“The fact we are seeing prices rising and sales rebounding this spring tells us home buyers are returning with confidence after a challenging year for our market, with mortgage rates roughly doubling,” Lis said. “The latest MLS HPI® data show home prices have increased about five per cent year-to-date, which already outpaces our forecast of one to two per cent by year-end. The year is far from over, however, and it remains to be seen if these price increases will be sustained into 2024.”


There were 4,307 detached, attached and apartment properties newly listed for sale on the Multiple Listing Service® (MLS®) in Metro Vancouver in April 2023. This represents a 29.7 per cent decrease compared to the 6,128 homes listed in April 2022, and was 22 per cent below the 10-year seasonal average (5,525).


The total number of homes currently listed for sale on the MLS® system in Metro Vancouver is 8,790, a 4.2 per cent decrease compared to April 2022 (9,176), and 20.9 per cent below the 10-year seasonal average (11,117).


Across all detached, attached and apartment property types, the sales-to-active listings ratio for April 2023 is 32.7 per cent. By property type, the ratio is 24.4 per cent for detached homes, 40.1 per cent for townhomes, and 37.4 per cent for apartments.


Analysis of the historical data suggests downward pressure on home prices occurs when the ratio dips below 12 per cent for a sustained period, while home prices often experience upward pressure when it surpasses 20 per cent over several months.

“When we released our market forecast in January, we were one of the only organizations taking the contrarian view that prices were likely to appreciate in 2023,” Lis said. “And what we’re seeing unfold so far this year is consistent with our prediction that near record-low inventory levels would create competitive conditions where almost any resurgence in demand would translate to price escalation, despite the elevated borrowing cost environment. At the crux of it, the issue remains a matter of far too little resale supply available relative to the pool of active buyers in our market.”


The MLS® Home Price Index composite benchmark price for all residential properties in Metro Vancouver is currently $1,170,700. This represents a 7.4 per cent decrease over April 2022 and a 2.4 per cent increase compared to March 2023.


Sales of detached homes in April 2023 reached 808, a 16.3 per cent decrease from the 965 detached sales recorded in April 2022. The benchmark price for detached properties is $1,915,800. This represents an 8.8 per cent decrease from April 2022 and a 2.9 per cent increase compared to March 2023.


Sales of apartment homes reached 1,413 in April 2023, a 16.5 per cent decrease compared to the 1,693 sales in April 2022. The benchmark price of an apartment property is $752,300. This represents a 3.1 per cent decrease from April 2022 and a two per cent increase compared to March 2023.


Attached home sales in April 2023 totalled 500, a 13.5 per cent decrease compared to the 578 sales in April 2022. The benchmark price of an attached unit is $1,078,400. This represents a 6.1 per cent decrease from April 2022 and a 2.1 per cent increase compared to March 2023.


Read

Andrew and Jill's May 2023 Stats Pack East and West from the Vancouver Real Estate Board.

The Latest 2023 Market Stats by area are out and available for download. You get the following graphs and charts for both Vancouver East and Vancouver West.

  • Activity Snapshot by Property

  • Type Detached Properties Report and Graph

  • Condo Report and Graph

  • Townhomes Report and Graph

  • Benchmark Price Graph

  • Average Price Per Square Foot

If you are interested in a report like this is for other areas, please contact us to request it and I'll send it to you.

GET THE FULL REPORT

Read

Competition among buyers in Metro Vancouver’s housing market heats up as summer arrives

While the year started slower than usual, Metro Vancouver’s housing market is showing signs of heating up as summer arrives, with prices increasing for the sixth consecutive month.

The Real Estate Board of Greater Vancouver (REBGV) reports that residential home sales in the region totalled 3,411 in May 2023, which is a 15.7 per cent increase from the 2,947 sales recorded in May 2022, and a 1.4 per cent decline from the 10-year seasonal average (3,458).

“Back in January, few people would have predicted prices to be up as much as they are – ourselves included,” Andrew Lis, REBGV’s director of economics and data analytics said. “Our forecast projected prices to be up modestly in 2023 by about two per cent at year-end. Instead, Metro Vancouver home prices are already up about six per cent or more across all home types at the midway point of the year.”

There were 5,661 detached, attached and apartment properties newly listed for sale on the Multiple Listing Service® (MLS®) in Metro Vancouver in May 2023. This represents an 11.5 per cent decrease compared to the 6,397 homes listed in May 2022, and was 4.3 per cent below the 10-year seasonal average (5,917).

The total number of homes currently listed for sale on the MLS® system in Metro Vancouver is 9,293, a 10.5 per cent decrease compared to May 2022 (10,382), and 20.6 per cent below the 10-year seasonal average (11,705).

Across all detached, attached and apartment property types, the sales-to-active listings ratio for May 2023 is 38.4 per cent. By property type, the ratio is 28.5 per cent for detached homes, 45 per cent for townhomes, and 45.5 per cent for apartments.

Analysis of the historical data suggests downward pressure on home prices occurs when the ratio dips below 12 per cent for a sustained period, while home prices often experience upward pressure when it surpasses 20 per cent over several months.

“You don’t have to squint to see the reason prices continue to increase. The fundamental issue remains that there are more buyers relative to the number of willing sellers in the market. This is keeping the amount of resale homes available in short supply,” Lis said. “And in a surprising twist, MLS® sales in May snapped back closer to historical averages than we’ve seen in the recent past, despite mortgage rates being where they are now, and new listing activity having been slower than usual this spring. If mortgage rates weren’t holding back market activity so much right now, I think our market would look a lot like the heydays of 2021/22, or even 2016/17.”

The MLS® Home Price Index composite benchmark price for all residential properties in Metro Vancouver is currently $1,188,000. This represents a 5.6 per cent decrease over May 2022 and a 1.3 per cent increase compared to April 2023.

Sales of detached homes in May 2023 reached 1,043, a 30.7 per cent increase from the 798 detached sales recorded in May 2022. The benchmark price for a detached home is $1,953,600. This represents a 6.7 per cent decrease from May 2022 and a 1.8 per cent increase compared to April 2023.

Sales of apartment homes reached 1,730 in May 2023, a 7.9 per cent increase compared to the 1,604 sales in May 2022. The benchmark price of an apartment home is $760,800. This represents a two per cent decrease from May 2022 and a 1.1 per cent increase compared to April 2023.

Attached home sales in May 2023 totalled 608, a 16.7 per cent increase compared to the 521 sales in May 2022. The benchmark price of an attached home is $1,083,000. This represents a 4.7 per cent decrease from May 2022 and a 0.2 per cent increase compared to April 2023.


Read

Andrew and Jill's Latest 2023 Stats Pack East and West from the Vancouver Real Estate Board.

The Latest 2023 Market Stats by area are out and available for download. You get the following graphs and charts for both Vancouver East and Vancouver West.

  • Activity Snapshot by Property
  • Type Detached Properties Report and Graph
  • Condo Report and Graph
  • Townhomes Report and Graph
  • Benchmark Price Graph
  • Average Price Per Square Foot

If you are interested in a report like this is for other areas, please contact us to request it and I'll send it to you.

GET THE FULL REPORT

Read

Spring brings renewed price growth across Metro Vancouver’s housing market while new listings remain dormant

Home prices across Metro Vancouver’s housing market showed modest increases in March, while new listings remained below long-term historical averages.

March data also indicates home sales are making a stronger than expected spring showing so far, despite elevated borrowing costs.

The Real Estate Board of Greater Vancouver (REBGV) reports that residential home sales in the region totalled 2,5352 in March 2023, a 42.5 per cent decrease from the 4,405 sales recorded in March 2022, and 28.4 per cent below the 10-year seasonal average (3,540).

The MLS® Home Price Index composite benchmark price for all residential properties in Metro Vancouver is currently $1,143,900. This represents a 9.5 per cent decrease over March 2022 and a 1.8 per cent increase compared to February 2023.

“On the pricing side, the spring market is already on track to outpace our 2023 forecast, which anticipated modest price increases of about one to two per cent across all product types,” Andrew Lis, REBGV’s director of economics and data analytics said. “The surprising part of this recent activity is that these price increases are occurring against a backdrop of elevated borrowing costs, below-average sales, and new listing activity that continues to suggest that sellers are awaiting more favorable market conditions.”

There were 4,317 detached, attached and apartment properties newly listed for sale on the Multiple Listing Service® (MLS®) in Metro Vancouver in March 2023. This represents a 35.5 per cent decrease compared to the 6,690 homes listed in March 2022, and was 22.3 per cent below the 10-year seasonal average (5,553).

The total number of homes currently listed for sale on the MLS® system in Metro Vancouver is 8,617, an 8.1 per cent increase compared to March 2022 (7,970), and 17.3 per cent below the 10-year seasonal average (10,421).

Across all detached, attached and apartment property types, the sales-to-active listings ratio for March 2023 is 30.7 per cent. By property type, the ratio is 23.3 per cent for detached homes, 36.7 per cent for townhomes, and 34.9 per cent for apartments.

Analysis of historical data suggests downward pressure on home prices occurs when the ratio dips below 12 per cent for a sustained period, while home prices often experience upward pressure when it surpasses 20 per cent over several months.

“If home sellers remain on the sidelines, monthly MLS® sales figures will continue to appear lower than historical averages as we move toward summer,” Lis said. “But it’s important to recognize the chicken-and-egg nature of these statistics. The number of sales in any given month is partially determined by the number of homes that come to market that month, along with the inventory of unsold homes listed in previous months. With fewer homes coming on the market, homes sales will remain lower than we’re accustomed to seeing at this point in the year, almost entirely by definition.”

Sales of detached homes in March 2023 reached 734, a 43.6 per cent decrease from the 1,302 detached sales recorded in March 2022. The benchmark price for detached properties is $1,861,800. This represents an 11.2 per cent decrease from March 2022 and a 2.7 per cent increase compared to February 2023.

Sales of apartment homes reached 1,311 in March 2023, a 43.2 per cent decrease compared to the 2,310 sales in March 2022. The benchmark price of an apartment property is $737,400. This represents a 4.6 per cent decrease from March 2022 and a 0.7 per cent increase compared to February 2023.

Attached home sales in March 2023 totalled 466, a 37.3 per cent decrease compared to the 743 sales in March 2022. The benchmark price of an attached unit is $1,056,400. This represents a 7.8 per cent decrease from March 2022 and a 1.7 per cent increase compared to February 2023.

GET THE FULL REPORT

Read

ANDREW AND JILL'S LATEST 2023 STATS PACK EAST AND WEST FROM THE VANCOUVER REAL ESTATE BOARD

The Latest 2023 Market Stats by area are out and available for download. You get the following graphs and charts for both Vancouver East and Vancouver West.

  • Activity Snapshot by Property
  • Type Detached Properties Report and Graph
  • Condo Report and Graph
  • Townhomes Report and Graph
  • Benchmark Price Graph
  • Average Price Per Square Foot

If you are interested in a report like this is for other areas, please contact us to request it and I'll send it to you.

GET THE FULL REPORT

Read

Below average home sales allow inventory to inch upwards

VANCOUVER, BC – March 2, 2023 – February listing data show a continued reluctance among prospective home sellers to engage in Metro Vancouver’s* housing market, leading to below-average sales activity. With sales remaining well-below historical norms, the number of available homes for sale in the region have continued inching upwards.

The Real Estate Board of Greater Vancouver (REBGV) reports that residential home sales in the region totalled 1,808 in February 2023, a 47.2 per cent decrease from the 3,424 sales recorded in February 2022, and a 76.9 per cent increase from the 1,022 homes sold in January 2023.
Last month’s sales were 33 per cent below the 10-year February sales average.

“It’s hard to sell what you don’t have, and with new listing activity remaining among the lowest in recent history, sales are struggling to hit typical levels for this point in the year,” said Andrew Lis, REBGV’s director, economics and data analytics. “On the plus side for prospective buyers, the below-average sales activity is allowing inventory to accumulate, which is keeping market conditions from straying too deeply into sellers’ market territory, particularly in the more affordably priced segments.”

There were 3,467 detached, attached and apartment properties newly listed for sale on the Multiple Listing Service® (MLS®) in Metro Vancouver in February 2023. This represents a 36.6 per cent decrease compared to the 5,471 homes listed in February 2022 and a 5.2 per cent increase compared to January 2023 when 3,297 homes were listed.

The total number of homes currently listed for sale on the MLS® system in Metro Vancouver is 7,868, a 16.7 per cent increase compared to February 2022 (6,742) and a 5.2 per cent increase compared to January 2023 (7,478).

“While we continue to expect home price trends to show year-over-year declines for a few more months, current data and market activity suggest pricing is firming up. In fact, some leading indicators suggest we may see modest price increases this spring, particularly if sales activity increases and mortgage rates hold steady,” Lis said. “In the somewhat unusual market environment we find ourselves in right now with higher mortgage rates, fewer sales, and inventory that is inching higher but remains far from abundant, working with a Realtor who understands your local market conditions and has experience navigating challenging markets is paramount.”

For all property types, the sales-to-active listings ratio for February 2023 is 23 per cent. By property type, the ratio is 16.8 per cent for detached homes, 30.1 per cent for townhomes, and 25.8 per cent for apartments.

Generally, analysts say downward pressure on home prices occurs when the ratio dips below 12 per cent for a sustained period, while home prices often experience upward pressure when it surpasses 20 per cent over several months.

The MLS® Home Price Index composite benchmark price for all residential properties in Metro Vancouver is currently $1,123,400. This represents a 9.3 per cent decrease over February 2022 and a 1.1 per cent increase compared to January 2023.

Sales of detached homes in February 2023 reached 514, a 49.1 per cent decrease from the 1,010 detached sales recorded in February 2022. The benchmark price for detached properties is $1,813,100. This represents a 12 per cent decrease from February 2022 and a 0.7 per cent increase compared to January 2023.

Sales of apartment homes reached 928 in February 2023, a 49.9 per cent decrease compared to the 1,854 sales in February 2022. The benchmark price of an apartment property is $732,200. This represents a three per cent decrease from February 2022 and a 1.6 per cent increase compared to January 2023.

Attached home sales in February 2023 totalled 366, a 34.6 per cent decrease compared to the 560 sales in February 2022. The benchmark price of an attached unit is $1,038,500. This represents a 6.3 per cent decrease from February 2022 and a 1.8 per cent increase compared to January 2023.

GET THE FULL REPORT

Read

Andrew and Jill's Latest 2023 Stats Pack East and West from the Vancouver Real Estate Board

The Latest 2023 Market Stats by area are out and available for download. You get the following graphs and charts for both Vancouver East and Vancouver West.

  • Activity Snapshot by Property
  • Type Detached Properties Report and Graph
  • Condo Report and Graph
  • Townhomes Report and Graph
  • Benchmark Price Graph
  • Average Price Per Square Foot

If you are interested in a report like this is for other areas, please contact us to request it and I'll send it to you.

GET THE FULL REPORT

Read
Reciprocity Logo The data relating to real estate on this website comes in part from the MLS® Reciprocity program of either the Greater Vancouver REALTORS® (GVR), the Fraser Valley Real Estate Board (FVREB) or the Chilliwack and District Real Estate Board (CADREB). Real estate listings held by participating real estate firms are marked with the MLS® logo and detailed information about the listing includes the name of the listing agent. This representation is based in whole or part on data generated by either the GVR, the FVREB or the CADREB which assumes no responsibility for its accuracy. The materials contained on this page may not be reproduced without the express written consent of either the GVR, the FVREB or the CADREB.