RSS

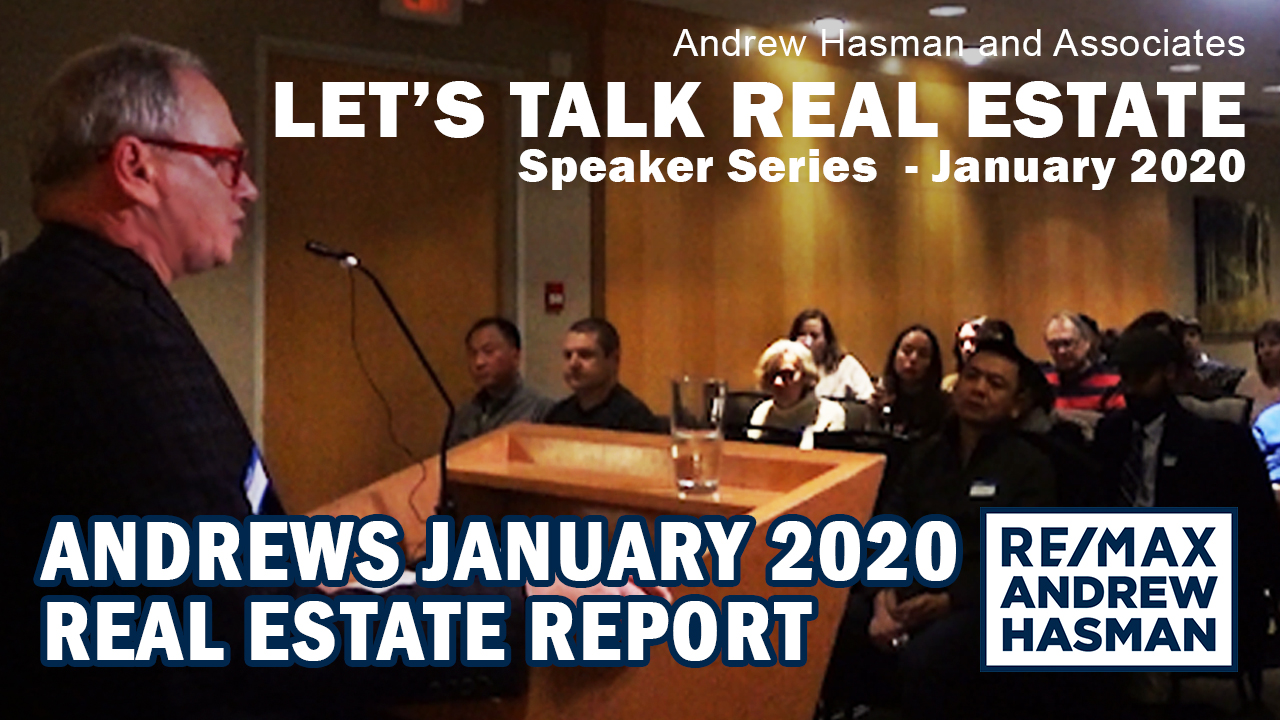
Last year saw record low sales, this was due to new taxes on foreign buyers and uncertainty around that with both buyers and sellers, with some sub-markets such as the luxury housing sector seeing drops in price between 25% and 30%, while the larger market saw declines in price between 10 and 30%. We entered 2019 with many markets seeing more than 20 months of supply, that is enough houses on the market relative to buyers that it would take 20 months to sell them all. Prices tend to fall in markets where supplies of more than 9 months worth of houses persist for 3 months or more, 2019 was thus an extreme case of this and saw significant declines.


We feel that the market has picked up significantly since then, going from a buyer's market in the summer of last year to a more balanced market now, back to 10-year averages. We believe this was as buyers who had waited to see what would happen to the market with the introduction of the new tax, decided it was time to buy. By mid-october every house that we sold went into multiple offers, a clear indication that we had started to enter into a seller's market. We expect spring and summer sales are likely to be back at their traditional levels. So, while the market has rebounded since the loss last year, we also believe that it may be more stable moving forward as more of the demand comes from local buyers.


For those looking to sell their place, be sure to make it market ready, we can help with this, this can mean correcting issues that exist before the buyer finds them, and getting quotes on issues that you don't want to fix right now to give to the buyer. We suggest doing a pre-listing home inspection performed on your home, this is a very affordable service that can save you thousands of dollars later in negotiations with buyers. The last thing you want is buyers finding something that you weren't aware of in a home inspection and then wanting to negotiate a lower price with you because of it, or losing a buyer entirely. Don't rush your property to the market, you should rather spend 500 on a fix than have to renegotiate for $10,000.


Read

Real Estate Board December Stats For Vancouver East & West


The December 2019 Market stats are out and available for download. You get the following graphs and charts for both Vancouver East and Vancouver West.


  • Activity Snapshot by PropertyType
  • Detached Properties Report and Graph
  • Condo Report and Graph
  • Townhomes Report and Graph
  • Benchmark Price Graph
  • Average Price Per Square Foot

If you are interested in a report like this is for other areas, please contact me to request it and I'll send it to you.


DOWNLOAD VANCOUVER WEST

DOWNLOAD VANCOUVER EAST

Read

Home sales decline below long-term averages in 2019 despite increased demand to end the year


The Metro Vancouver housing market experienced below average sales activity and moderate price declines in 2019.


The Real Estate Board of Greater Vancouver (REBGV) reports that sales of detached, attached and apartment homes reached 25,351 in 2019, a three per cent increase from the 24,619 sales recorded in 2018, and a 29.6 per cent decrease over the 35,993 residential sales in 2017.


Last year’s sales total was 20.3 per cent below the region’s 10-year sales average.


“We didn’t see typical seasonal patterns in 2019. Home buyer demand was quieter in the normally busy spring season and it picked up in the second half of the year,” Ashley Smith, REBGV president said. “In terms of home values, prices dipped between two and four per cent across the region last year depending on property type.”


Home listings on the Multiple Listing Service® (MLS®) in Metro Vancouver reached 51,918 in 2019. This is a 3.2 per cent decrease compared to the 53,614 homes listed in 2018 and a five per cent decrease compared to the 54,655 homes listed in 2017.


Last year’s listings total was 7.6 per cent below the 10-year average.


“Home buyer confidence was a factor throughout the year. In the first quarter, many prospective buyers were in a holding pattern, waiting to see how prices would react to the mortgage stress test, new taxes, and other policy changes,” Smith said. “Confidence started to return in the summer, and we saw above average sales in the final quarter of 2019.”


The MLS® HPI composite benchmark price for all residential properties in Metro Vancouver ends the year at $1,001,000. This is a 3.1 per cent decrease compared to December 2018.


The benchmark price of apartments decreased 2.7 per cent in the region last year. Townhomes decreased 2.4 per cent and detached homes decreased four per cent.


December summary


REBGV reports that residential home sales in the region totalled 2,016 in December 2019, an 88.1 per cent increase from the 1,072 sales recorded in December 2018, and a 19.3 per cent decrease from the 2,498 homes sold in November 2019.


Last month’s sales were 9.5 per cent above the 10-year December sales average.


There were 1,588 detached, attached and apartment properties newly listed for sale on the MLS® in Metro Vancouver in December 2019. This represents a 12.9 per cent increase compared to the 1,407 homes listed in December 2018 and a 46.8 per cent decrease compared to November 2019 when 2,987 homes were listed.

The total number of homes currently listed for sale on the MLS® system in Metro Vancouver is 8,603, a 16.3 per cent decrease compared to December 2018 (10,275) and a 20.1 per cent decrease compared to November 2019 (10,770).


For all property types, the sales-to-active listings ratio for December 2019 is 23.4 per cent. By property type, the ratio is 15.2 per cent for detached homes, 25.7 per cent for townhomes, and 32.5 per cent for apartments.


Generally, analysts say that downward pressure on home prices occurs when the ratio dips below 12 per cent for a sustained period, while home prices often experience upward pressure when it surpasses 20 per cent over several months.


Sales of detached homes in December 2019 reached 599, a 72.1 per cent increase from the 348 detached sales recorded in December 2018. The benchmark price for detached properties is $1,423,500. This represents a four per cent decrease from December 2018, and a 0.6 per cent increase compared to November 2019.


Sales of apartment homes reached 1,053 in December 2019, a 96.8 per cent increase compared to the 535 sales in December 2018. The benchmark price of an apartment property is $656,700. This represents a 2.7 per cent decrease from December 2018, and a 0.8 per cent increase compared to November 2019.


Attached home sales in December 2019 totalled 364, a 92.6 per cent increase compared to the 189 sales in December 2018. The benchmark price of an attached home is $778,400. This represents a 2.4 per cent decrease from December 2018, and a 0.7 per cent increase compared to November 2019.


GET THE FULL REPORT

Read

Real Estate Board November Stats For Vancouver East & West

The November 2019 Market stats are out and available for download. You get the following graphs and charts for both Vancouver East and Vancouver West.

  • Activity Snapshot by PropertyType
  • Detached Properties Report and Graph
  • Condo Report and Graph
  • Townhomes Report and Graph
  • Benchmark Price Graph
  • Average Price Per Square Foot
If you are interested in a report like this is for other areas, please contact me to request it and I'll send it to you.
 
Read

Metro Vancouver home sales return to historically typical levels


After a quieter first half of 2019, home buyer activity has returned to more historically typical levels in Metro Vancouver.


The Real Estate Board of Greater Vancouver (REBGV) reports that residential home sales in the region totalled 2,498 in November 2019, a 55.3 per cent increase from the 1,608 sales recorded in November 2018, and a 12.6 per cent decline from the 2,858 homes sold in October 2019.


Last month’s sales were four per cent above the 10-year November sales average.


“We started to see more home buyer confidence in the summer and this trend continues today,” says Ashley Smith, REBGV president. “It’ll be important to watch home listing levels over the next few months to see if supply can stay in line with home buyer demand.”


There were 2,987 detached, attached and apartment homes newly listed for sale on the Multiple Listing Service® (MLS®) in Metro Vancouver in November 2019. This represents a 13.7 per cent decrease compared to the 3,461 homes listed in November 2018 and a 26.7 per cent decrease compared to October 2019 when 4,074 homes were listed.


The total number of homes currently listed for sale on the MLS® system in Metro Vancouver is 10,770, a 12.5 per cent decrease compared to November 2018 (12,307) and a 12 per cent decrease compared to October 2019 (12,236).


For all property types, the sales-to-active listings ratio for November 2019 is 23.2 per cent. By property type, the ratio is 17.2 per cent for detached homes, 24.9 per cent for townhomes, and 29.3 per cent for apartments.

Generally, analysts say downward pressure on home prices occurs when the ratio dips below 12 per cent for a sustained period, while home prices often experience upward pressure when it surpasses 20 per cent over several months.


“In today’s market, the intensity of home buyer demand depends on neighbourhood, property type, and price point,” Smith said. “To better understand the changing trends in your neighbourhood and property type of choice, it’s important to work with your local REALTOR®.”


The MLS® Home Price Index composite benchmark price for all residential properties in Metro Vancouver is currently $993,700. This represents a 4.6 per cent decrease from November 2018 and a 1.3 per cent decrease over the past six months.


Sales of detached homes in November 2019 reached 825, a 59.9 per cent increase from the 516 detached sales recorded in November 2018. The benchmark price for a detached home is $1,415,400. This represents a 5.8 per cent decrease from November 2018, a 0.5 per cent decrease over the past six months, and a 0.3 per cent increase compared to October 2019.


Sales of apartment homes reached 1,222 in November 2019, a 50.9 per cent increase compared to the 810 sales in November 2018. The benchmark price of an apartment home is $651,500. This represents a 3.8 per cent decrease from November 2018, a 1.9 per cent decrease over the past six months, and a 0.2 per cent decline compared to October 2019.


Attached home sales in November 2019 totalled 451, a 59.9 per cent increase compared to the 282 sales in November 2018. The benchmark price of an attached home is $772,800. This represents a 4.4 per cent decrease from November 2018, a 0.8 per cent decrease over the past six months, and a 0.2 per cent increase compared to October 2019.


GET THE FULL REPORT

Read

We have sold a property at 2151 TRIUMPH ST in Vancouver
We have sold a property at 2151 TRIUMPH ST in Vancouver.
Open House Sun Nov 10th, 2-4. Ideal for young couple wanting their own front door and private yard. Beautifully maintained 2 level half duplex in sought after in Hastings Sunrise . NO STRATA FEES!! Close to trendy restaurants, coffee bars & shopping. This home features 10 ft ceilings on main with lots of natural light and open floor plan. If you are craving outdoor space this home has its own private yard. Upstairs there are 2 bedrooms. Single car garage too. Buy this home to move in or buy for investment. Radiant HW Heat, HRV. This home is a winner!!
Read

Open House. Open House on Sunday, November 17, 2019 2:00PM - 4:00PM
Please visit our Open House at 307 1477 15TH AVE W in Vancouver.
Open House on Sunday, November 17, 2019 2:00PM - 4:00PM
Location does not get any better than this. In the heart of So Granville's trendy shopping district. Walk to everything. Quiet East facing 2 bedroom. Concrete & Steel building. Shaughnessy Mansions is a Heritage converted property. Suite shows like new w Hardwood floors, high end appliance package, refinished kitchen cabinets, large east facing balcony. Loads of natural light. Flex space can be a small home office, pantry or storage. Pets & Rentals OK. Makes an awesome rental investment property. This suite and its location is top notch. Open House Sun Nov 17, 2-4.
Read

New property listed in Fairview VW, Vancouver West
We have listed a new property at 307 1477 15TH AVE W in Vancouver.
Location does not get any better than this. In the heart of So Granville's trendy shopping district. Walk to everything. Quiet East facing 2 bedroom. Concrete & Steel building. Shaughnessy Mansions is a Heritage converted property. Suite shows like new w Hardwood floors, high end appliance package, refinished kitchen cabinets, large east facing balcony. Loads of natural light. Flex space can be a small home office, pantry or storage. Pets & Rentals OK. Makes an awesome rental investment property. This suite and its location is top notch.
Read

REAL ESTATE BOARD OCTOBER STATS FOR VANCOUVER EAST & WEST

The October 2019 Market stats are out and available for download. You get the following graphs and charts for both Vancouver East and Vancouver West.

  • Activity Snapshot by PropertyType
  • Detached Properties Report and Graph
  • Condo Report and Graph
  • Townhomes Report and Graph
  • Benchmark Price Graph
  • Average Price Per Square Foot
If you are interested in a report like this is for other areas, please contact me to request it and I'll send it to you.
 
Read

New property listed in Kitsilano, Vancouver West
We have listed a new property at 206 2211 5TH AVE W in Vancouver.
Nicely updated Kits 1 bedroom. Awesome location just a block to trendy West 4th shopping. Everything at your door step. Buy this condo to live in or for investment. Building allows pets & rentals. Shared Laundry only. Suite was updated back in 2007. Complex has new exterior windows & sliding doors, new elevator, updated lobby and Plumbing & roof were updated 2002 & 2004. Allow 24 hours notice to show. Great value.
Read
Reciprocity Logo The data relating to real estate on this website comes in part from the MLS® Reciprocity program of either the Greater Vancouver REALTORS® (GVR), the Fraser Valley Real Estate Board (FVREB) or the Chilliwack and District Real Estate Board (CADREB). Real estate listings held by participating real estate firms are marked with the MLS® logo and detailed information about the listing includes the name of the listing agent. This representation is based in whole or part on data generated by either the GVR, the FVREB or the CADREB which assumes no responsibility for its accuracy. The materials contained on this page may not be reproduced without the express written consent of either the GVR, the FVREB or the CADREB.